
Font size
 Worksheets
HW 3.3 - Scatter Plots/Lines of Best Fit
Total questions: 30
Worksheet time: 5hrs 0mins


Which is a true statement about two numerical sets of data that have negative association?
A. As one variable increases, the other variable does not change.
B. As one variable increases, the other variable increases.
C. As one variable decreases, the other variable decreases.
D. As one variable increases, the other variable decreases.


What type of correlation would you likely see with:
The amount of time spent working compared to the amount of money earned
positive correlation
negative correlation
no correlation
What type of correlation would you likely see with:
The amount of time students spent playing video games the night before a test compared to their respective grades on that test
positive correlation
negative correlation
no correlation
What type of correlation would you likely see with:
The number of siblings a person has compared to the number of sodas they drink per day
positive correlation
negative correlation
no correlation

What type of correlation do the data here represent?
positive
negative
no correlation
Temperature of a rubber band and distance the rubber band can stretch. r=.84
strong positive
strong negative
weak positive
weak negative
Car weight and distance traveled using a full tank of gas. r=−.86
strong positive
strong negative
weak positive
weak negative
Which scatter plot diagram shows the strongest positive correlation?
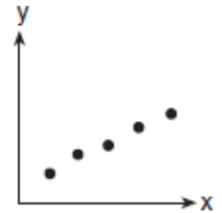
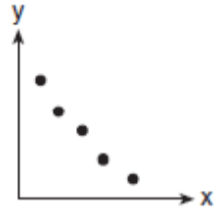
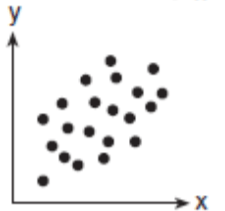
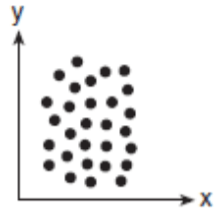
r = -0.3 is considered to have...
moderate negative correlation
weak negative correlation
no correlation
strong negative correlation
Which of the following examples is not causation?
When the student population at school increases, the number of teachers at school increases.
When the amount of sugar in apple juice decreases, there are fewer calories in each serving.
When there are more workers on a project, the project takes less time to complete.
When there is more protein in an athlete's diet, the athlete scores more points in a game.
When the temperature outside decreases, the layers you wear increases.
Causation
Association
Neither
A survey showed that sleeping with a night light was positively associated with nearsightedness. Is this association or causation?
Association
Causation
Neither
A study showed a positive relationship between students owning a cell phone and driving a car to school. Is this association or causation?
Association
Causation
Neither
Order the scatterplots from STRONGEST to WEAKEST correlation coefficients


Order the correlation coefficients from WEAKEST linear relationship to STRONGEST
Hint: Close to 0 - Weak
Close to 1/-1 - Strong
r = 0.45
r = -0.50
r = 0.80
r = -0.89

