
 Worksheets
Unit 1 Quiz 1
Total questions: 20
Worksheet time: 20mins
What is the range?
The sum of the largest and smallest number
The number in the middle
The difference between the largest and smallest number
The number that appears most often
What is the median?
The number in the middle when the numbers are in order from least to greatest.
The difference between the largest and smallest number.
The average
The number that appears most often.
The number of miles that Jenna cycled each week for a 7-week period is shown:
36, 42, 28, 52, 48, 36, 31
What is the median number of miles Jenna cycled?
24
39
36
52

Dr. Dre is a dentist. He needs to report on the average (Mean) number of cavities that his patients have.
1, 0, 1, 5, 0, 3, 4. What is the average number of cavities?
14
2
7
1
What measure of center is best to use when we have outliers?
mean
median
mode
range

Which of the following statements is true about the Rizalyn’s scores in her subject areas?
She has more consistent scores in Math than English
She has more consistent scores in Science than Math
She has more consistent score in Science than English
She has more consistent score in Math than Science

What subject has most consistent scores?
English
Math
Science
Which is true about the measures of variability?
The smaller the standard deviation, the less reliable the scores.
The higher the standard deviation, the more reliable the scores.
The smaller the standard deviation, the less spread the distribution.
The smaller the standard deviation, the more spread the distribution.

Ervin bowled 7 games last weekend. His scores are: 155, 165, 138, 172, 127, 193, 142. What is the standard deviation of Ervin's scores?
511.33
22.61
438.48
20.94

An appropriate Window Setting could look like:
XMin (a)
XMax (b)
Scal (c)
YMin (d)
YMax (e)
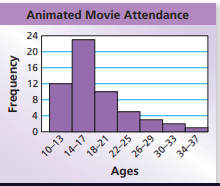
What is the shape of the data?
symmetrical
skewed left
skewed right
bell curve

What is the shape of the data?
symmetrical
skewed left
skewed right
bell curve

Describe the shape of the graph.
Symmetrical
Skewed
Uniform
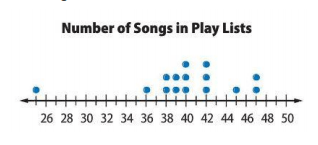
Which statement best describes this graph?
There is a peak at 47.
There is a cluster around 38-40.
The mode is 40.
There is a gap in the data between 39-40.
When looking at the 1-variable Stats screens match the meanings of each symbol
x = (a)
θ = (b)
n = (c)
Xmin = (d)
Q1 = (e)
When looking at the 1-variable Stats screens match the meanings of each symbol
Xmin = (a)
Q1 = (b)
Med = (c)
Q3 = (d)
Xmax = (e)

