Worksheets
Pie chart Test
Total questions: 31
Worksheet time: 1hrs 8mins

What angle would you use to represent 40 red cars out of 90 cars in total on a pie chart?
40 degrees
160 degrees
4 degrees
90 degrees

How many degrees are there in a half turn (semicircle)?
90
120
45
180
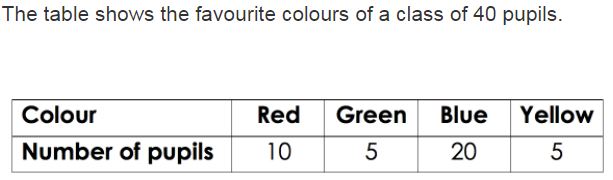
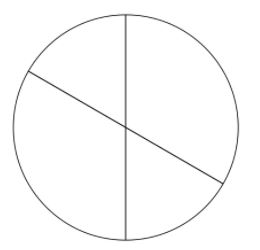
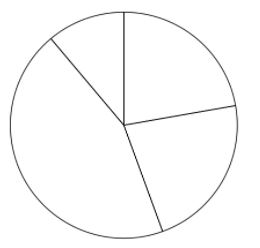
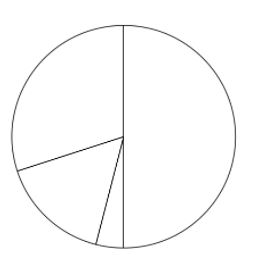
Which pie chart represents the same data as the table?
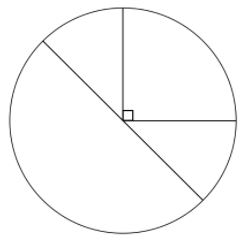

This pie chart shows the colour of hats that Tim owns. What fraction of Tim's hats are blue?
41
25
31
75
A darts player hits his target 40% of the time. Which pie chart represents his hits and misses?


The pie chart shows colours of motorbikes in a shop. There are 20 more blue bikes than white. How many bikes are there altogether?
54
160
40
80

A diver wants to make a pie chart of his trip. Which one of these is a correct method for finding F?
360−180+45
2012×360
360−180−45
32360

90 yellow sheep are tested for a disease. How many sheep have the disease?
140
30
70
35


If there are 300 seventh graders, how many students prefer choir?
96
24
75
42
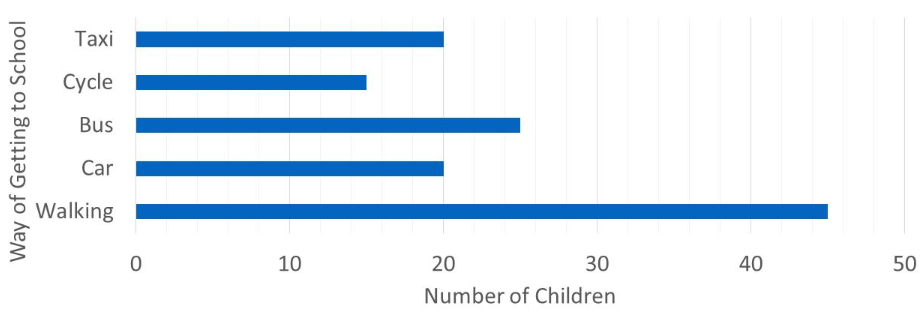
How many more children walk than take a taxi to school?
45
20
25
35
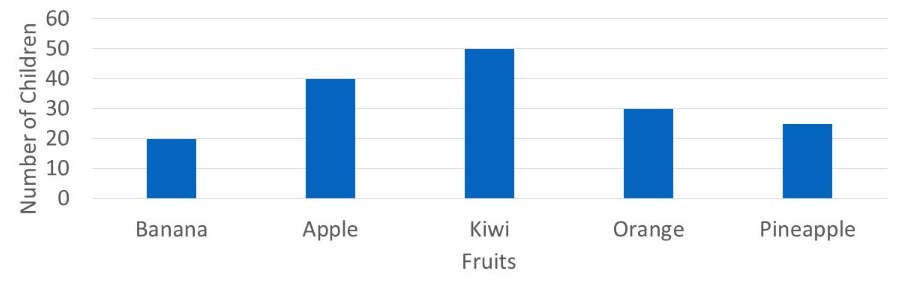
Which of the following statements is true?
banana is the most popular fruit
only pineapple is liked less than oranges
kiwi is the most popular fruit
apple is the third most popular fruit
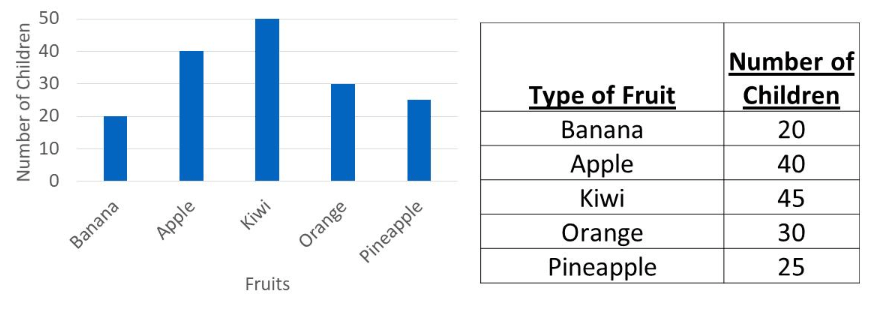
Which fruit's bar is displayed correctly?
banana
orange
apple
kiwi
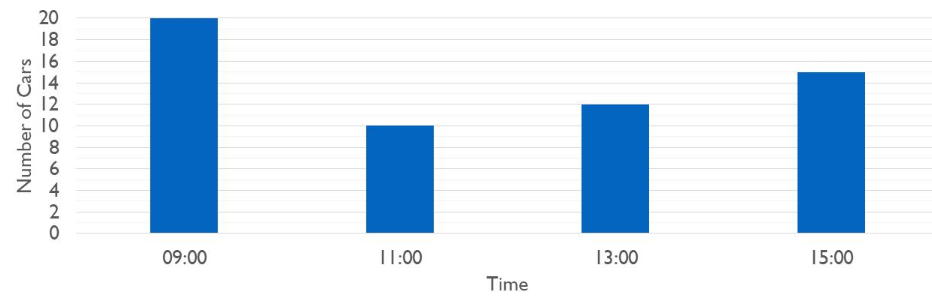
How many more cars pass at 15:00 than at 13:00?
4
10
2
3
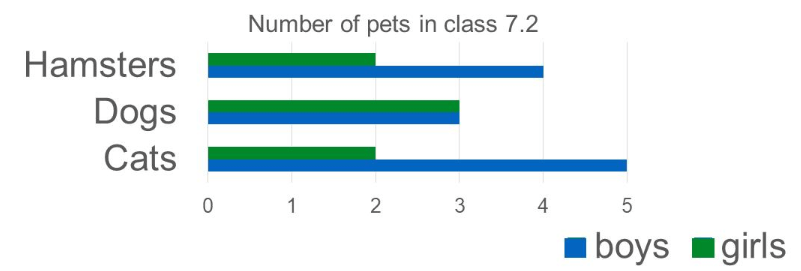
From the bar chart, how many pets do the girls in the class have?
19
12
7
you can't tell
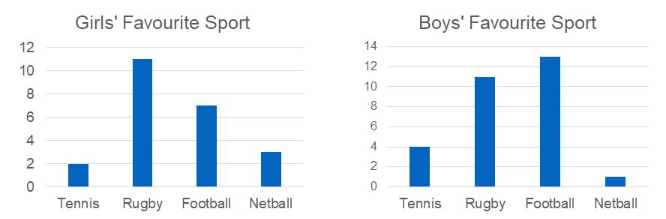
Which sport was picked by the same number of girls and boys?
tennis
football
netball
rugby
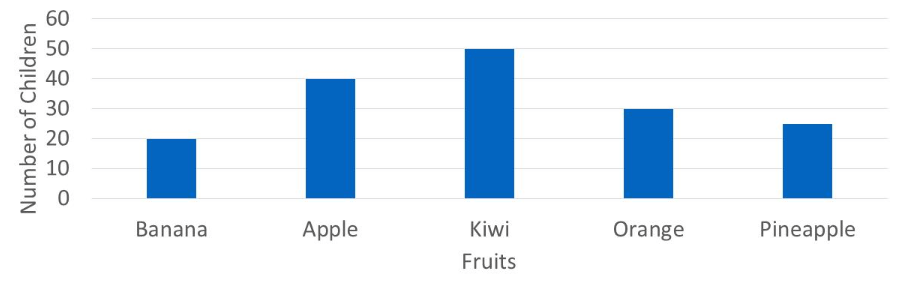
Which of the following statements is true?
pineapple is the most popular
only apple is liked more than orange
kiwi is the least popular fruit
apple is the second most popular fruit
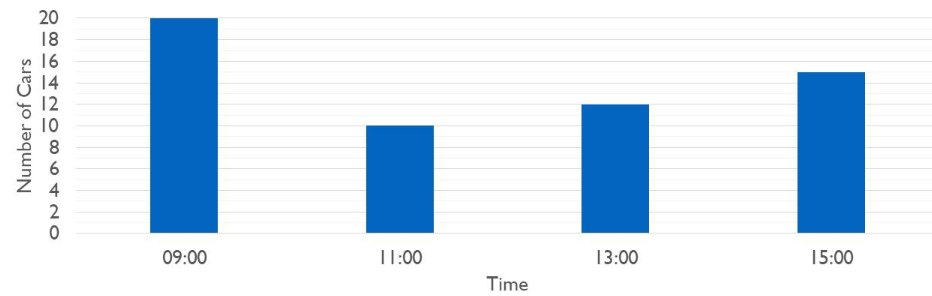
How many more cars pass at 15:00 than at 11:00?
10
5
4
3





From Tuesday to Wednesday there is ....