
 Worksheets
Tawa College - Junior - Bar Graph Interpretation
Total questions: 35
Worksheet time: 1hrs 3mins



The graph shows the number of colored beads used to make a necklace. How many purple and green beads were used in all?
23
20
18
15



[Question 1 and 2 are based on the bar chart]
1.Choose the correct statement(s).
The most number of discharged cases was recorded on Tuesday.
The number of discharged cases on Monday is more than the number of discharged cases on Tuesday
Thursday records the least number of discharged cases
The number of discharged cases on Friday is more than 200 cases

2.Choose the incorrect statement(s).
About 20 patients were discharged on Thursday.
On Tuesday, a total number of 300 patients got discharged.
More than 100 patients were tested negative and discharged on Monday.
The difference between the number of discharged cases on Wednesday and Thursday is about 100.
[Question 1 and 2 are based on the bar chart]
1.Choose the correct statement(s).
The most number of discharged cases was recorded on Tuesday.
The number of discharged cases on Monday is more than the number of discharged cases on Tuesday
Thursday records the least number of discharged cases
The number of discharged cases on Friday is more than 200 cases

[Question 3 and 4 are based on this bar chart]
3.The number of computers sold in 2017 is 3 times the number of computers sold in 2013.
Calculate the number of computers sold in 2017.
600
750
900
1200

4.How many computers are sold from 2013 to 2017?
3400
3000
2850
2600

The diagram is a bar chart which shows the number of apples in boxes W and X.
The number of apples in box Y and the number of apples in box Z are not shown.
The total number of apples in the four boxes is 140.
The number of apples in box W and box Y are the same.
Calculate the total number of apples in box Y and box Z.
35
45
65
70

The bar chart shows the number of chickens sold by a farmer in 5 days.
On which two days are the total sales equal to the sales on Tuesday?
Monday
Tuesday
Wednesday
Thursday
Friday

The diagram is a pictograph showing the numbers of durians sold on Wednesday, Thursday and Friday.
The number of sales on Saturday is half of the total sales on Wednesday and Thursday.
What is the number of durian sales on Saturday?
(a)

The diagram is a bar graph showing the number of foreign tourists who visited the National Museum in three days.
The total tourists for three days are 295 people. The number of tourists who came to the National Museum on Sunday is 5 people lesser than on Friday.
Calculate the number of tourists on Sunday.
(a)

The pictograph shows the weekly pocket money received by Sally.
Sally saves RM 9 every week. How much money does she spend in all 4 weeks?
(a)

The pictograph shows the number of plates of fried noodles sold at a restaurant in four days.
The difference in the profit obtained on Saturday and Sunday is RM 3000.
Calculate the total profit obtained for the first two days.
RM 4 500
RM 7 500
RM 12 000
RM 19 200

The bar chart shows the number of students from four classes who scored A in Mathematics subject.
The overall total of Year 4 students who scored A is 80 people.
Calculate the number of students who scored A for the class of 4 Sejahtera.
(a)

The diagram is a bar chart shows the favourite shapes of a group of pupils.
If each pupil is given a chance to name two shapes that they like, what is the total number of pupils in the group?
20
21
40
42


The bar graph shows the number of hamburgers sold at Bob’s Burger Shack. On which days were more than 80 hamburgers sold?
Wednesday and Friday
Tuesday and Thursday
Monday, Tuesday, and Thursday
Tuesday, Wednesday, Thursday, and Friday

Look at the bar graph, "Nicest Fruit". What does the x-axis show?
Types of fruit
The number of people.

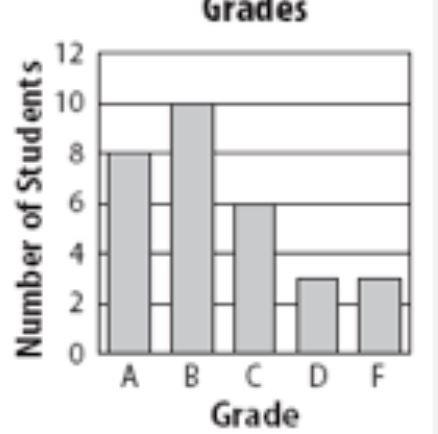
Look at the Bar Graph "Student Grades". Which grade did the smallest number of students get?
A
B
C
D

The graph shows the number of cars sold from January to April. How many more cars were sold in March than in January?
2,000
5,000
7,000
8,000

The teacher wants to have 40 more pencils than erasers. What is the total number of supplies?
20
10
30
60
125

How many scoops of ice cream was sold in the month of September?
150
300
20
50
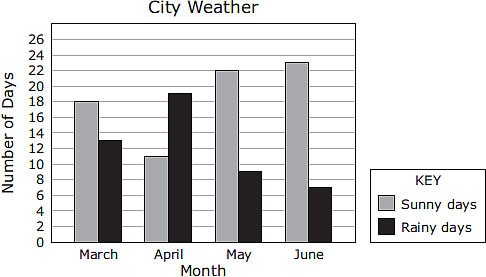
Based on the graph,how many more sunny days than rainy days did this city have during the months of April, May, and June?
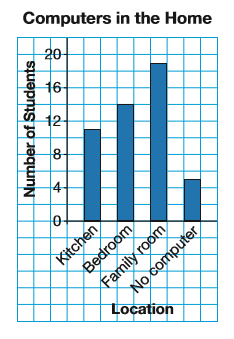
Which room had the second most votes?
Kitchen
Bedroom
Family Room


What percentage of children are under the height of 80cm?
4%
16%
84%
20%

