
 Worksheets
Reading a Graph
Total questions: 15
Worksheet time: 1hrs 1mins
Name
Class
Date
1.

Which vegetables would equal 50% of the vote? There are two answers.
a)
Carrots and Potatoes
b)
Zucchini and Squash
c)
Carrots and Tomatoes
d)
Zucchini, Squash, and Potatoes
2.

Which two types of books takes up 25% of the Pie Graph?
a)
Poem Books
b)
Story Books
c)
Comic Books
d)
Puzzle Books
3.

Which two letters are about the same size as letter D (purple)?
a)
E (orange)
b)
A (red)
c)
C (green)
d)
B (blue)
4.

How many chickens does Nate have on his farm?
a)
11
b)
12
c)
9
d)
10
5.

According to this graph, what is the most popular flavor of Jolly Rancher?
a)
Cherry
b)
Grape
c)
Blue Rasberry
d)
Watermelon
6.

Which Letter is the following ordered pair: (– 4, 2)
a)
A
b)
B
c)
C
d)
D
7.

What type of graph is this?
a)
Tally Chart
b)
Line Graph
c)
Circle Graph
d)
Bar Graph
8.

How many people voted for red as their favorite color?
a)
100
b)
2
c)
4
d)
9
9.

What does graph B illustrate?
a)
Alphabet Letters
b)
Homework Grades
c)
Excluded Grades
d)
Test Grades
10.

Which category shows the fewest endangered species?
French: Quelle catégorie montre le moins d'espèces menacées?
French: Quelle catégorie montre le moins d'espèces menacées?
a)
Amphibians
b)
Reptiles
c)
Snails (Escargot)
d)
Arachnids
11.

What percantage people choose zucchini?
a)
15%
b)
25%
c)
30%
d)
10%
12.
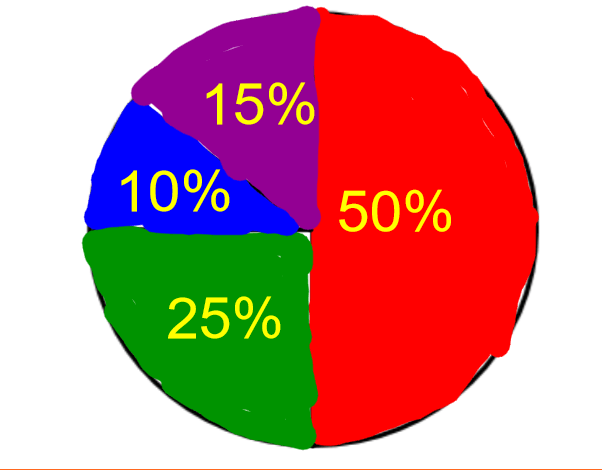
120 people were surveyed. How many liked green?
a)
50
b)
45
c)
30
d)
25
13.

How many students' favorite color is blue?
a)
11
b)
12
c)
14
d)
17
14.

Which movie genre is the least favorite?
a)
SciFi
b)
Drama
c)
Romance
d)
Comedy
e)
Action
15.

How many total votes were collected?
a)
5
b)
10
c)
15
d)
20
100 %

