
 Worksheets
Unit #7 Practice AP Test
Total questions: 20
Worksheet time: 2hrs 40mins
Anne claims that a store-brand fertilizer works better than homemade compost as a soil enhancement when growing tomatoes. To test her theory, she plants two tomato plants in each of five planters. One plant in each planter is grown in soil with a store-brand fertilizer and the other plant is grown in soil with homemade compost, with the choice of soil chosen at random. In three months, she will harvest and weigh the tomatoes from each plant. Which of the following is the correct confidence interval Anne should use to analyze the data?
Two sample z interval for μ1−μ2
Paired z interval for μdiff
Two sample t interval for μ1−μ2
Paired t interval for μdiff
The correct interval cannot be determined without the data
The weights (in pounds) of three adult males are 160, 215, and 195. What is the standard error of the mean for these data?
190
27.84
22.73
16.07
13.13
You want to compute a 90% confidence interval for the mean difference in height for mothers and their adult daughters using a random sample of 30 mothers who have an adult daughter. What critical value should you use for this interval?
1.645
1.671
1.697
1.699
1.761
We want to construct a one-sample t interval for a population mean using data from a population with unknown shape. In which of the following circumstances would it be inappropriate to construct the interval based on an SRS of size 14 from the population?
A stemplot of the data is roughly bell-shaped
A histogram of the data shows slight-skewness
A boxplot shows that the values above the median are much more variable than the values below the median
The sample standard deviation is large
The sample standard deviation is small
A 90% confidence interval for the mean m of a population is computed from a random sample and is found to be . Which of the following could be the 95% confidence interval based on the same data?
90±21
90±30
90±39
90±78
Without knowing the sample size, any of the above answer could be the 95% confidence interval
Do high school seniors with part-time jobs spend less time doing homework per week, on average, than seniors without part-time jobs? For a random sample of 45 seniors with part-time jobs, the mean amount of homework time is 4.2 hours with a standard deviation of 3.8 hours. For a random sample of 45 seniors without part-time jobs, the mean amount of homework time is 5.8 hours with a standard deviation of 4.9 hours. Assuming the conditions are met, which of the following is the correct standard error for a 95% confidence interval for a difference in population means?


Few people enjoy melted ice cream. Being from the sunny state of Arizona, Megan and Jenna decided to test if generic vanilla ice cream melts faster than Breyers vanilla ice cream. At 10 different times during the day and night, the girls put a single scoop of each type of ice cream in the same location outside and timed how long it took for each scoop to melt completely. When constructing a paired t interval for a mean difference using these data, which of the following distributions should Megan and Jenna check for normality?
I. The distribution of melt time for the generic ice cream
II. The distribution of melt time for the Breyers ice cream
III. The distribution of difference in melt time
I only
II only
III only
I and II only
I, II, and III only
A Census Bureau report on the income of Americans says that with 90% confidence, the median income of all U.S. households in a recent year was $57,005, with a margin of error of $742. Which of the following is the most appropriate conclusion?
90% of all households has incomes in the interval 57,005±742
We can be sure that the median income for all households in the county lies in the interval 57,005±742
90% of the households in the sample interviewed by the Census Bureau had incomes in the interval 57,005±742
The Census Bureau got the result 57,005±742 using a method that will capture the true median income 90% of the time when used repeatedly
90% of all the samples of this sample size would result in a sample median that falls within $742 of $57,005
A quiz question gives random samples of n = 10 observations from each of two Normally distributed populations. Tom uses a table of t distribution critical values and 9 degrees of freedom to calculate a 95% confidence interval for the difference in population means. Janelle uses her calculator’s two-sample t interval with 16.87 degrees of freedom to compute the 95% confidence interval. Assume that both students calculate the intervals correctly. Which of the following is true?
Tom’s confidence interval is wider
Janelle’s confidence interval is wider
Both confidence intervals are the same width
There is insufficient information to determine which confidence interval is wider
Janelle made a mistake; degrees of freedom has to be a whole number
The makers of a specialty brand of bottled water claim that their “mini” bottles contain 8 ounces of water. To investigate this claim, a consumer advocate randomly selected a sample of 10 bottles and carefully measured the amount of water in each bottle. The mean volume was 7.98 ounces and the 95% confidence interval for the true mean volume is 7.93 to 8.03 ounces. Based on the sample, which of the following conclusions best addresses the maker’s claim?
Because 7.98 is in the interval, there is convincing evidence, that their claim is correct.
Because 7.98 is in the interval, there is not convincing evidence, that their claim is incorrect.
Because 8 is in the interval, there is convincing evidence, that their claim is correct.
Because 8 is in the interval, there is not convincing evidence, that their claim is incorrect.
Because 0 is in the interval, there is convincing evidence, that their claim is incorrect.
Experiments on learning in animals sometimes measure how long it takes mice to find their way through a maze. The mean time is 18 seconds for one particular maze. A researcher thinks that a loud noise will cause mice to complete the maze faster. She measures how long each of 20 takes with a noise stimulus. What are the null and alternative hypotheses for the appropriate significant test?


You are thinking of conducting a one-sample t test about a population mean m using a 0.05 significance level. Which of the following is correct?
You should not carry out the test if the sample does not have a Normal distribution
You can safely carry out the test if there are no outliers regardless of the sample size
You can carry out the test if a graph of the data shows no strong skewness, regardless of the sample size.
You can carry out the test only if the population standard deviation is known.
You can safely carry out the test if your sample size is at least 30.
A 95% confidence interval for m based on n = 15 observations from a Normal population is (-0.73, 1.92) If we use this confidence interval to test the hypotheses H0: μ=0 against Ha: μ=0 , which of the following is the most appropriate conclusion?
Reject Ho at the a = 0.05 level of significance
Fail to reject Ho at the a = 0.05 level of significance
Reject Ho at the a = 0.10 level of significance
Fail to reject Ho at the a = 0.10 level of significance
We cannot perform the required test since we do not know that value of the standardized test statistic
Which of the following has the smallest probability?
P(t > 2) if t has 5 degrees of freedom
P(t > 2) if t has 2 degrees of freedom
P(z > 2) is z is a standard Normal variable
P(t < 2) if t has 5 degrees of freedom
P(z < 2) is z is a standard Normal variable
A significance test was performed to test H0: μ=2 versus the alternative Ha:μ=2 . A sample of size 28 produced a standardized test statistic of t = 2.051. Assuming all conditions for inference were met, which of the following intervals contains the P-value for this test?
0.01 < P < 0.02
0.02 < P < 0.025
0.025 < P < 0.05
0.05 < P < 0.10
P > 0.10
A study of road rage asked separate random samples of 596 men and 523 women about their behavior while driving. Based on their answers, each respondent was assigned a road rage score on a scale of 0 to 20. Are the conditions for performing a two-sample t test satisfied?
Maybe; we have independent random samples, but we need to look at the data to check Normality.
No; road rage scores in a range between 0 and 20 can’t be Normal.
No; we don’t know the population standard deviations.
Yes; the large sample sizes guarantee that the corresponding population distributions will be Normal.
Yes; we have two independent random samples and large sample sizes.
A researcher wished to compare the average amount of time spent in extracurricular activities by high school students in a suburban school district with that in a school district of a large city. The researcher obtained an SRS of 60 high school students in a large suburban school district and found the mean time spent in extracurricular activities per week to be 6 hours with a standard deviation of 3 hours. The researcher also obtained an independent SRS of 40 high school students in a large city school district and found the mean time spent in extracurricular activities per week to be 5 hours with a standard deviation of 2 hours. Suppose that the researcher decides to carry out a significance test of H0: μsuburban = μcity versus a two-sided alternative.
Which of the following is the correct standardized test statistic?

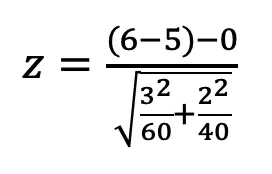
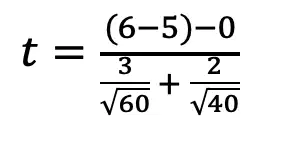
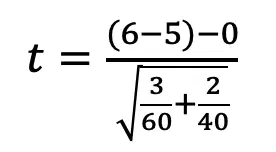
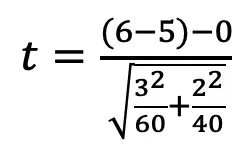
A researcher wished to compare the average amount of time spent in extracurricular activities by high school students in a suburban school district with that in a school district of a large city. The researcher obtained an SRS of 60 high school students in a large suburban school district and found the mean time spent in extracurricular activities per week to be 6 hours with a standard deviation of 3 hours. The researcher also obtained an independent SRS of 40 high school students in a large city school district and found the mean time spent in extracurricular activities per week to be 5 hours with a standard deviation of 2 hours. Suppose that the researcher decides to carry out a significance test of H0: μsuburban = μcity versus a two-sided alternative.
The P-value for the test is 0.048. A correct conclusion is to
fail to reject H0 at the α = 0.05 level. There is convincing evidence of a difference in the average time spent on extracurricular activities by students in the suburban and city school districts.
fail to reject H0 at the α = 0.05 level. There is not convincing evidence of a difference in the average time spent on extracurricular activities by students in the suburban and city school districts.
fail to reject H0 at the α = 0.05 level. There is convincing evidence that the average time spent on extracurricular activities by students in the suburban and city school districts is the same.
reject H0 at the α = 0.05 level. There is not convincing evidence of a difference in the average time spent on extracurricular activities by students in the suburban and city school districts.
reject H0 at the α = 0.05 level. There is convincing evidence of a difference in the average time spent on extracurricular activities by students in the suburban and city school districts
Are TV commercials louder than their surrounding programs? To find out, researchers collected data on 50 randomly selected commercials in a given week. With the television’s volume at a fixed setting, they measured the maximum loudness of each commercial and the maximum loudness in the first 30 seconds of regular programming that followed. Assuming conditions for inference are met, the most appropriate method for answering the question of interest is
A two-sample t test for a difference in means
A two-sample t interval for a difference in means
A paired t test for a mean difference
A paired t interval for a mean difference
A two-sample z test for a difference in proportions
Researchers are interested in evaluating the effect of a natural product on reducing blood pressure. This will be done by comparing the mean reduction in blood pressure of a treatment (natural product) group and a placebo group using a two-sample t test. The researchers would like to be able to detect whether the natural product reduces blood pressure by at least 7 points more, on average, than the placebo. If groups of size 50 are used in the experiment, a two-sample t test using α = 0.01 will have a power of 80% to detect a 7-point difference in mean blood pressure reduction. If the researchers want to be able to detect a 5-point difference instead, then the power of the test
would be less than 80%.
would be greater than 80%.
would still be 80%.
could be either less than or greater than 80%, depending on whether the natural product is effective.
would vary depending on the standard deviation of the data.

