
Font size
 Worksheets
5th Grade STAAR Daily Spiral Math 2
Total questions: 12
Worksheet time: 26mins
A driveway is 40 ft long and 14 ft wide. What is the perimeter of the driveway?
Un camino de entrada tiene 40 pies de largo y 14 pies de ancho. ¿Cuál es el perímetro del camino de entrada?
(a)
A cafeteria worker used 8.05 kilograms of meat to make 35 lunches. Each lunch had the same amount of meat. What was the mass in kilograms of the meat in each lunch?
Un trabajador de una cafetería utilizó 8.05 kilogramos de carne para preparar 35 almuerzos. Cada almuerzo tenía la misma cantidad de carne. ¿Cuál fue la masa en kilogramos de la carne en cada almuerzo?
(a)
A man bought 6 cans of tuna. Each can of tuna cost $0.93.
What is the total amount of money the man spent on the cans of tuna?
Un hombre compró 6 latas de atún. Cada lata de atún cuesta $0.93.
¿Cuál es la cantidad total de dinero que gastó el hombre en las latas de atún?
(a)
What is the value of this expression?
¿Cuál es el valor de esta expresión?
51 ÷ 30
1501
61
150
6
Which model represents the expression 3÷21 ?
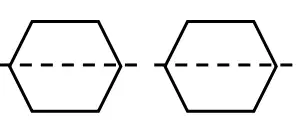


An expression is shown.
What is the value of the expression?
Se muestra una expresión.
¿Cuál es el valor de la expresión?
7[10.32−5(1.6)]
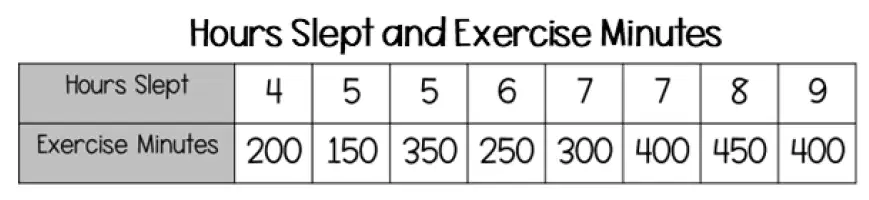
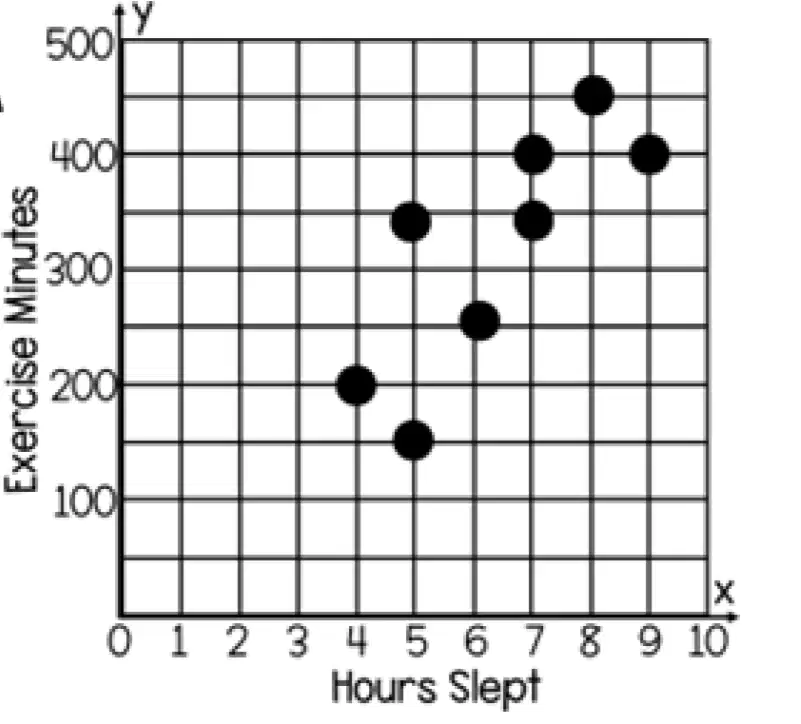
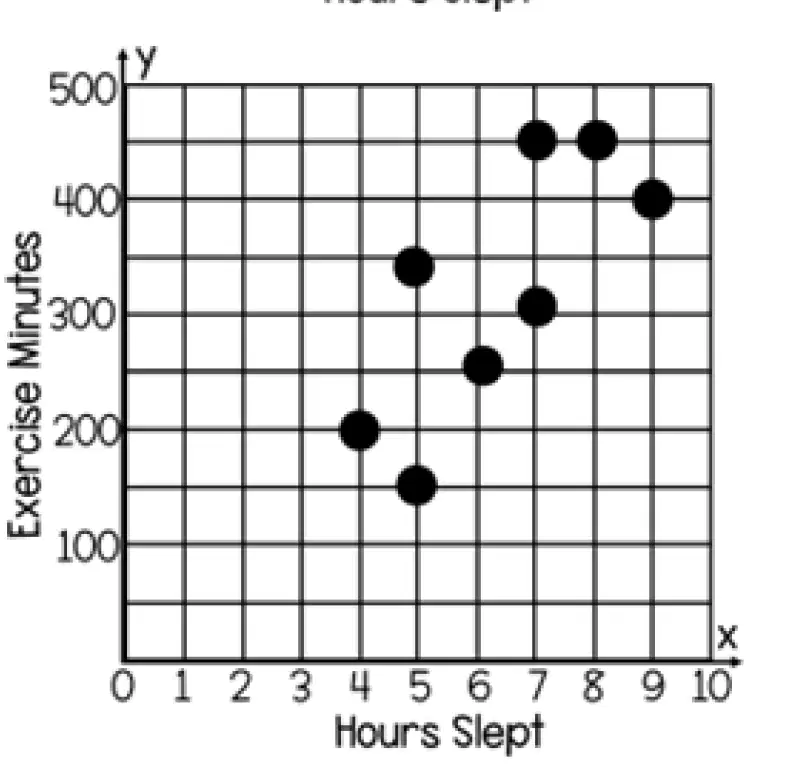
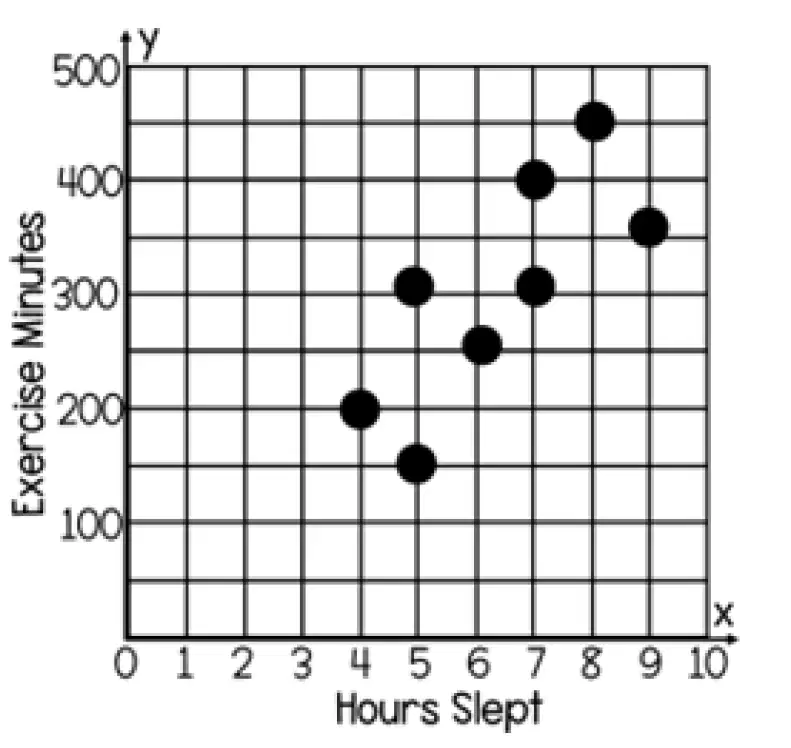
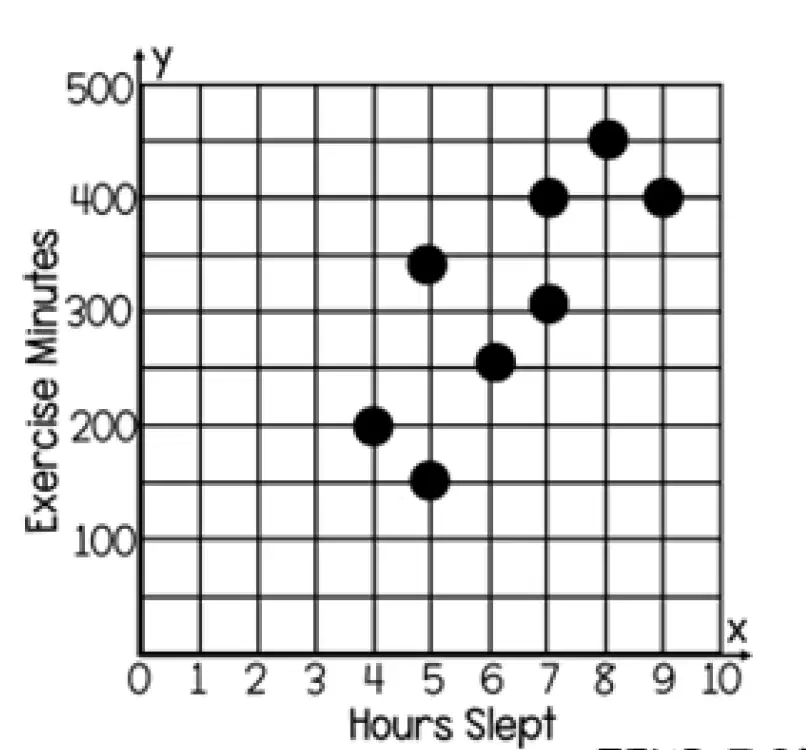
The table shows the hours eight people sleep each night and the number of minutes they exercise each week.
Which scatterplot represents the data on the table?
La tabla muestra las horas que duermen ocho personas cada noche y la cantidad de minutos que hacen ejercicio cada semana.
¿Qué diagrama de dispersión representa los datos de la tabla?
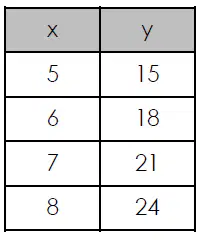
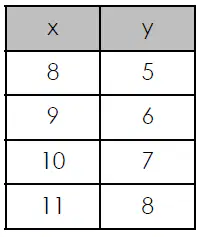
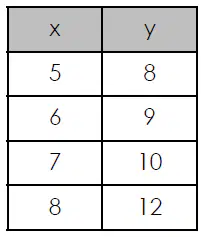
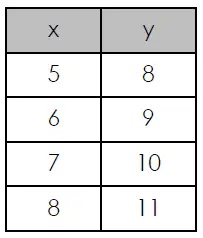
The points plotted on the coordinate grid represent the rule y = x +3 . Which table also represents this rule?
Los puntos trazados en la cuadrícula de coordenadas representan la regla y=x+3 . ¿Qué tabla también representa esta regla?
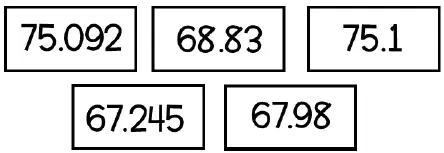
A group of five numbers is shown. Daniel ordered the numbers from least to greatest. Which number was in the third position?
Se muestra un grupo de cinco números. Daniel ordenó los números de menor a mayor. ¿Qué número estaba en la tercera posición?
75.092
75.1
68.83
67.98
During the weekend, Jon drank 9.5 bottles of water. Each bottle contained 1.7 liters of water. How many liters of water did Jon drink?
Durante el fin de semana, Jon bebió 9.5 botellas de agua. Cada botella contenía 1.7 litros de agua. ¿Cuántos litros de agua bebió Jon?
17.25 liters
18.2 liters
16.15 liters
19.35 liters
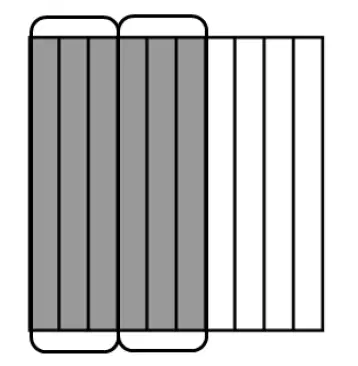
The hundredths model is shaded to represent a division problem. Which division problem does the model represent?
El modelo de centésimas está sombreado para representar un problema de división. ¿Qué problema de división representa el modelo?
0.6÷2=0.3
0.06÷2=0.03
0.06÷2=0.03
0.6÷2=0.03
Karol plotted the point (0,5) on the coordinate plane. Which describes the location of the point Karol plotted?
Karol marcó el punto (0,5) en el plano de coordenadas. ¿Cuál describe la ubicación del punto que Karol marcó?
The point is located on the x-axis.
El punto está ubicado en el eje x.
The point is located 5 units to the right of the y-axis.
El punto está ubicado 5 unidades a la derecha del eje y.
The point is located 3 units above the x-axis.
El punto está ubicado a 3 unidades por encima del eje x.
The point is located on the y-axis.
El punto está ubicado en el eje y.

