
NEW
Font size
S
M
L
XL
 Worksheets
Distance-time Graph
Total questions: 10
Worksheet time: 14mins
Name
Class
Date
1.

What does this graph represent?
a)
Constant Speed
b)
Acceleration
c)
Not moving
2.
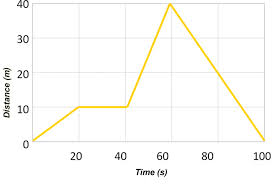
How long did it take this object to travel back to its reference/starting point?
a)
20 s
b)
30 s
c)
40 s
d)
50 s
3.

At 60 seconds, how far had this object traveled?
a)
0 m
b)
10 m
c)
20 m
d)
40 m
4.

What does this graph represent?
a)
Constant speed
b)
Acceleration
c)
Not moving
5.

Which runner had a head start?
a)
A
b)
B
c)
C
6.
What two measurements are necessary for calculating speed?
a)
Mass and time
b)
Temperature and mass
c)
Mass and distance
d)
Distance and time
7.
In which of the following graphs below are both runners moving at the same speed?
a)
b)
c)
d)
8.
Match the description to the graph:
"The car is coming back."
a)
b)
c)
d)
9.

Segment B-C The bus is _________________.
a)
at rest
b)
returning (to original position)
c)
moving forward
10.
Match the description to the graph:
"The car is traveling away from reference point at a constant speed."
a)
b)
c)
d)
Reset

