Wayground logo

Free Printable Worksheets

Font size

S
M
L
XL
Worksheets

Data and Statistics Quiz

Total questions: 66

Worksheet time: 3hrs 48mins

Name
Class
Date
1.
What is the highest score in the class?
a)
88%
b)
100%
c)
13
d)
98%
2.
How many students received a score of 94%? 
a)
94
b)
4
c)
1
d)
2
3.
How many total students are in the science class?
a)
13
b)
6
c)
27
d)
25
4.

What is the shape of the dot plot shown?

a)

skewed left

b)

skewed right

c)

symmetrical

5.

How many total students were surveyed about their number of brothers and sisters? (add up all of the dots)

a)

15

b)

10

c)

6

6.

How many students have a shoe size bigger than 8?

a)

2

b)

3

c)

4

d)

9

7.

How many people have 4 or more pets?

a)

8

b)

3

c)

6

d)

4

8.

How many students have 0 Brothers and Sisters?

a)

6 students

b)

0 students

c)

12 students

d)

10 students

9.

How many cars were sold on Thursday and Friday

a)

6

b)

7

c)

8

d)

9

10.

Identify the outlier of the data.

a)

9

b)

6

c)

8

d)

2

11.

What is the outlier for this data?

a)

90

b)

96

c)

102

d)

108

12.

What is the Mode of this data?

a)

10

b)

12

c)

6

d)

0

13.

What is the Range of this data?

a)

12

b)

9

c)

7

d)

5

14.
The mode is
a)
The middle score
b)
 Scores added & divided by the number of scores
c)
The most frequent score
d)
The middle when in order
15.
The median is
a)
The middle score
b)
 Scores added & divided by the number of scores
c)
The most frequent score
d)
The middle when in order
16.
Find the mean of these numbers:
5,11,2,12,4,2
a)
4.1
b)
6
c)
4.5
d)
4
17.
Identify the outlier for the given data?
23, 34, 27, 7, 30, 26, 28, 31, 34
a)
7
b)
23
c)
31
d)
34
18.

The spread/range is...

a)

the greatest number - the lowest number

b)

the average number (added together, then divided by the number of dots)

c)

The most frequent number

d)

The middle when in order

19.
Find the range.
5, 15, 10, 20, 15, 10, 15
a)
5
b)
10
c)
15
d)
13
20.
Find the median of these numbers:
4,2,7,4,3
a)
2
b)
5
c)
7
d)
4
21.

What is the maximum (upper extreme)?

a)

50

b)

45

c)

40

d)

35

22.

What is the minimum (lower extreme)?

a)

5

b)

10

c)

25

d)

35

23.

What is the third quartile (upper quartile)?

a)

25

b)

35

c)

45

d)

40

24.

What is the first quartile (lower quartile)?

a)

25

b)

10

c)

35

d)

5

25.

What is the median (Q2)?

a)

25

b)

35

c)

40

d)

25

26.
What is the median of the data?
a)
200
b)
100
c)
90
d)
140
27.
What is the interquartile range (IQR) of the data set?
a)
20
b)
25
c)
5
d)
10
28.
What is the interquartile range (IQR)?
a)
4
b)
64
c)
60
d)
8
29.

How many students took the math test?

a)

15

b)

20

c)

100

d)

65

30.

What is the minimum?

a)

100

b)

87

c)

99

d)

65

31.

What is the maximum?

a)

100

b)

87

c)

99

d)

65

32.

What is the range of the test scores?

a)

65

b)

35

c)

45

d)

55

33.

What is the mode of the test scores?

a)

88

b)

70

c)

100

d)

92

34.
What type of graph is this?
a)
Bar Graph
b)
Line Plot
c)
Pictograph
d)
Tally Chart
35.
What type of graph is this?
a)
Bar Graph
b)
Histogram
c)
Line Plot
36.

Describe the shape of the graph

a)

Skewed right

b)

Skewed left

c)

Uniform

d)

Symmetrical

37.

What is the shape of the distribution?

a)

Skewed Left

b)

Skewed Right

c)

Symmetric

d)

Uniform

38.

The average is called the __________

a)

mean

b)

median

c)

mode

d)

range

39.

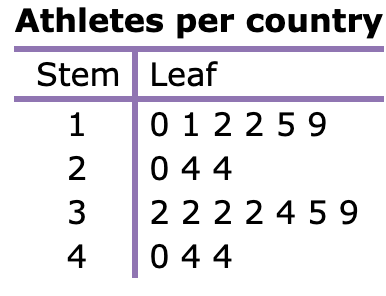
This is a...

a)

bar graph

b)

dot plot

c)

line plot

d)

stem and leaf plot

40.

What type of table is this?

a)

Frequency Table

b)

Tally Table

c)

Bar Graph

d)

Pictograph

41.

What type of graph is this?

a)

bar graph

b)

stem and leaf plot

c)

dot plot

42.

What is the maximum?

a)

20

b)

22

c)

24

d)

25

43.

This data has one peak which can also be known as…

a)

Bimodal

b)

Uniform

c)

Multimodal

d)

Unimodal

44.

This data has two peaks which is also known as…

a)

Multimodal

b)

Bimodal

c)

Unimodal

d)

Uniform

45.

Data with multiple peaks is also known as…

a)

Bimodal

b)

Uniform

c)

Multimodal

d)

Unimodal

46.

Data that has no peaks is also known as…

a)

Uniform

b)

Bimodal

c)

Unimodal

d)

Multimodal

47.
Which interval shows the greatest number of pets?
a)
15-19
b)
0-4
c)
5-9
d)
10-14
48.
How many cities have temperatures between 70 degrees and 99 degrees?
a)
44
b)
34
c)
26
d)
62
49.
What is an interval?
a)
A single number
b)
A range of numbers
c)
A percentage
d)
A total amount
50.
21. How many students are represented by the histogram?  
a)
Cannot be determined
b)
9
c)
31
d)
35
51.
How many students are between 48 and 51 inches tall?
a)
14
b)
8
c)
2
d)
0
52.
Which interval has 4 students?
a)
56-59
b)
60-63
c)
60-67
d)
48-51
53.

Which interval contained the fewest scores?

a)

0-9

b)

50-59

c)

both 0-9 and 50-59

d)

10-19

54.
Which interval has 400 employees?
a)
33-43
b)
0-10
c)
77-87
d)
66-76
55.

Where is the MEDIAN?

56.

Where is the MAXIMUM?

57.

Where is the MINIMUM?

58.

Where is the LOWER EXTREME?

59.

Where is the LOWER MEDIAN?

60.

Where is the FIRST QUARTILE?

61.

Where is Q1?

62.

Where is the LOWER QUARTILE?

63.

Where is the UPPER QUARTILE?

64.

Where is the THIRD QUARTILE?

65.

Where is Q3?

66.

Where is the UPPER MEDIAN?