
Font size
 Worksheets
Unit 6 Review - Data & Statistics
Total questions: 56
Worksheet time: 2hrs 13mins
How do you find the median of a data set that has two middle numbers?
You pick the higher middle number
You pick the lower middle number
Add the two middle numbers and divide it by 2
Subtract the two middle numbers and divide by 2

Which measure of central tendency would best represent this data? (a)

Which measure of central tendency best represents this data? (a)
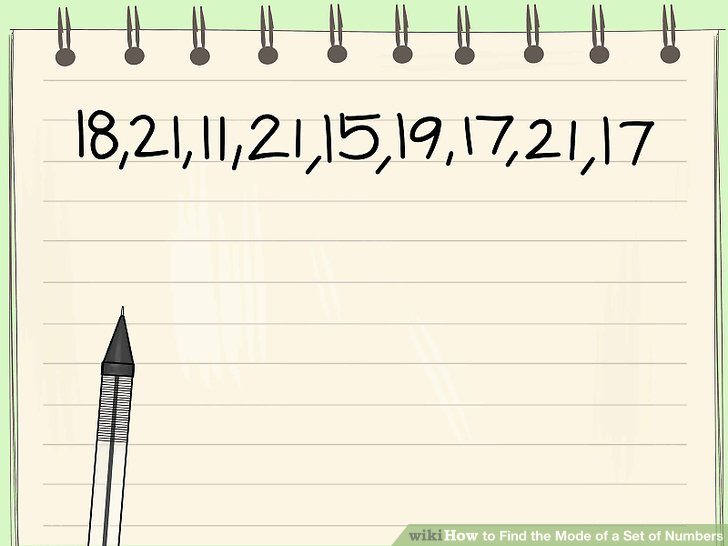
The mean of this data set is 17.8. What would happen to the mean if 40 was added to the data set? (a)

Which class has the higher median? (a)

Which class did better on the test? (a)

How is the data distributed in this histogram? (a)

How is the data distributed in this histogram? (a)
Calculate the MEAN for the data set: 6, 7, 12, 8, 7, 4, 8, 8, 7
Calculate the MEDIAN for the data set: 6, 7, 12, 8, 7, 4, 8, 8, 7
Calculate the MODE for the data set: 6, 7, 12, 8, 7, 4, 8, 8, 7 (a)
Calculate the RANGE for the data set: 6, 7, 12, 8, 7, 4, 8, 8, 7
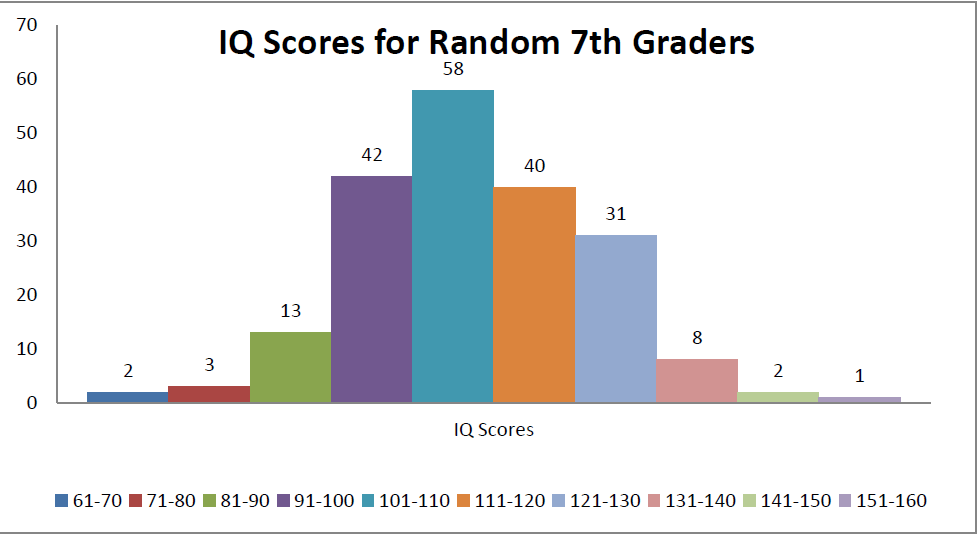
Calculate the relative frequency of having an IQ score in the 131-140 range. (200 7th graders were surveyed). (a)

Calculate the 5 number summary for the following data. You may use your graphing calculator. (a)
Find the Inter-Quartile Range (IQR). You may use your graphing calculator.
Find the Mean Absolute deviation of the following data: 4, 5, 5, 4
Round your answer to the nearest tenth.
Find the MAD of the following data: 14, 17,18, 22, 24
Round your answer to the nearest tenth.

What is the y intercept for this line of best fit?
What is an outlier?
A point far away from the other data points.
Any point NOT on a good line of fit.
Any point on a good line of fit.
The y-intercept.
Match the following.

Positive Linear Association

Negative Linear Association

Nonlinear Association

No Association
The data set below has an outlier of 42.2, 5, 12, 15, 19, 4, 6, 11, 16, 18, 12, 12, 42What effect does removing the outlier have on the distribution of the data? (a)
88, 92, 92, 96, 98
Gabriella scored a 20 on her sixth quiz. What effect does this score have?

Estimate the correlation coefficient (a)

Which graph shows the best trend line for the scatter plot? (a)

Which of the following is the BEST description of the data?
The mean is about 29.1, there is a peak at 30, gaps at 28 and 32, data is not symmetrical
The median is 29, there is a cluster from 26 – 31, peak at 29, no outlier
The mode is 29, there is a gap from 28 – 31, peak at 29, no outlier
The range is 7, there is a peak at 29, cluster from 29 – 31, gaps at 28 and 32


Don raises dogs. The heights, in centimeters, of Don's dogs are listed.
90,98,96,95,97,96,99,91,93,98,96,97,95,96
Which of the following statements accurately describes the shape, center, and spread of the data?
The mode is 96, there are gaps at 92 and 94, the distribution is skewed left, and 90 and 91 are outliers
The range is 9, there is a gap at 94, the distribution is skewed right, and there is peak at 96.
The mean is about 95.5, there are no gaps, the distribution is symmetrical, and 90 is an outlier.
the mean is about 95.5, there are no gaps, the distribution is symmetrical, and 90 is an outlier.
Jalen says that 60% of his teammates are over 70 inches. Is Jalen’s statement correct?
73, 61, 62, 59, 75, 60, 74, 75, 78, 69, 70
No, because there are 5 players with a height greater than 70 inches and that’s about 55% of the players
Yes, there are at least 9 players with a height of at least 70 inches and that is 60% of the players.
No, there is one player with a height of 70 inches and that is 9% of his teammates.
Yes, because the median height of the ponies is 60 and 60% of the ponies would be taller.
What is the IQR?
59, 60, 61, 62, 69, 70, 73, 74, 75, 75, 78
15
13
14
16
Number of steps taken per day and number of kilometers walked per day. r=.92
strong positive
strong negative
weak positive
weak negative
Average time spent listening to music per day and average time spent watching TV per day. r=−.17
strong positive
strong negative
weak positive
weak negative

Which one of these examples is NOT an example of CAUSATION?
Kryptonite causes Superman to lose all his powers.
Temperatures of less than 32˚F cause water to freeze.
Umbrellas cause rainstorms.
Stepping on the gas pedal causes a car to move faster.
Which example shows a CORRELATION? (The events show correlation, but one thing does NOT cause the other thing to happen.)
It rained and the ground is wet.
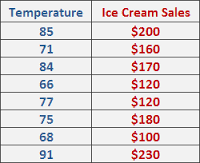
Ice cream sales increase as temperature increases.

Which type of regression model does the scatter plot appear to show?
linear
exponential
quadratic

A person travels by car. They record their miles driven in a data table. Calculate the line of best fit equation of this data.
y = 61.93x - 1.79
y = -1.79x + 61.93
y = 0.016x + 0.03
y = 0.03x + 0.016

Which graph most clearly shows a negative correlation between the x- and y- values?


For which set of data would a linear model best fit?


A chemist has a 100-gram sample of a radioactive material. He records the amount of radioactive material every week for 6 weeks and obtains the following data. Determine the exponential regression that best models these data.
y = 100(8.7)x
y = 100(1.87)x
y = 100(.87)x
y = 100(.13)x

Over the last ten years, a school recorded the number of eighth grade students enrolled in Algebra 1. Using the equation of the curve of best fit, approximately how many students will be enrolled in Algebra 1 on year 16 if the trend continues?
120
70
52
100
What character is used to "tell" Desmos to find a regression model?
*
&
~
#

Given this regression line information in Desmos, what is the equation of the regression line?
y = 0.9499x
y = 3.2x + 28
y = 0.95x + 0.90
y = 28x + 3.2

Given this information from Desmos, what is the equation of the regression model?
y=7.117x+1.39
y=7.117(1.39)x
y=0.983x+0.992
y=0.983(0.991)x
All of the data points will always fit perfectly on the line of best fit.
True
False
The Olympic record for the high jump is just over 2.6 yards. What is that distance in feet? (3 ft = 1 yd)
0.867 ft
7.8 ft
8.07 ft
8.27 ft

Americans drink 5,604,000 gallons of sweet tea each day. How many liters is that? (1 gal = 3.79 L)
21,200,000 L
21,239,160 L
21,207,190.2 L
21,000,000 L
Convert 62 miles/hour to feet/second. (5,280 ft = 1 mi)
5,456 ft/s
.003 ft/s
91 ft/s
909 ft/s

What will the resulting units be?
inches
feet
meters/ft
inches/ft

What will the resulting units be?
cubic feet per day
gallons per day
gallons per hour
cubic feet per hour

