Wayground logo

Free Printable Worksheets

Font size

S
M
L
XL
Worksheets

Data handling

Total questions: 87

Worksheet time: 2hrs 0mins

Name
Class
Date
1.
What type of graph is this?
a)
bar graph
b)
pictograph
c)
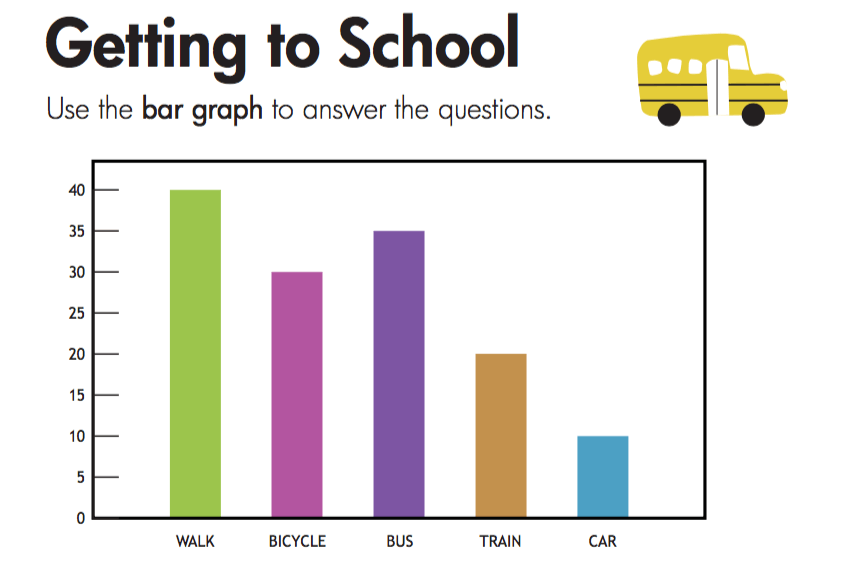
tally chart
2.
How many tally marks?
a)
9
b)
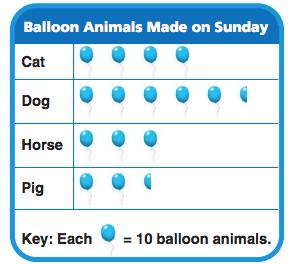
6
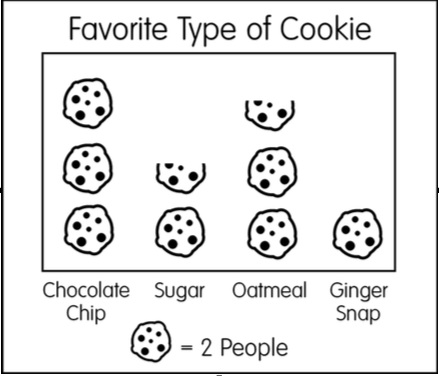
c)
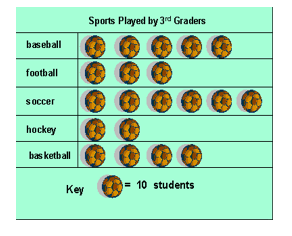
3
d)
7
3.

How many matches got 3 goals?

a)

2

b)

3

c)

4

d)

5

4.

Rozi collected data about his classmate favourite animal. How many friends who likes parrot as pet?

a)

10

b)

7

c)

12

d)

11

5.

What animal has least likes?

a)

budgie

b)

rabbit

c)

lizard

d)

hamster

6.

How many more cakes on Wednesday and Thursday?

a)

10 cakes

b)

25 cakes

c)

20 cakes

d)

15 cakes

7.

which type of graph is this???

a)

BAR GRAPH

b)

PICTOGRAPH

c)

TALLY MARK

d)

STIMY GRAPH

8.

How many Apples were sold in Thursday and Friday together???

a)

21

b)

22

c)

23

d)

12

9.

How many people loved decorating the tree???

a)

9

b)

5

c)

6

d)

3

10.

What is this chart called?

(a)  

11.

What type of graph is this?

(a)  

12.

How many tally marks?

a)

4

b)

5

c)

6

13.

Which pet got the most votes?

a)

Dog

b)

Cat

c)

Fish

14.

Look at the given tally marks chart. How many birds did Sara count on Friday?

a)

5

b)

7

c)

6

15.

Look at this pictogram.How many cup cakes sold on Wednesday?

a)

4

b)

24

c)

28

16.

This tally chart shows learners' favourite animals.

How many learners like Tiger and Deer?

a)

25

b)

26

c)

15

17.

This pictograph shows pumpkins picking by six people.

How many pumpkins did Nina pick?

Hint : Look carefully to the given key and then write your answer.

a)

16

b)

15

c)

6

18.

What is the most popular mode of transport to work?

a)

Park and ride

b)

Car

c)

Walk

d)

Cycle

19.
How many tally marks?
a)
12
b)
25
c)
15
d)
20
20.

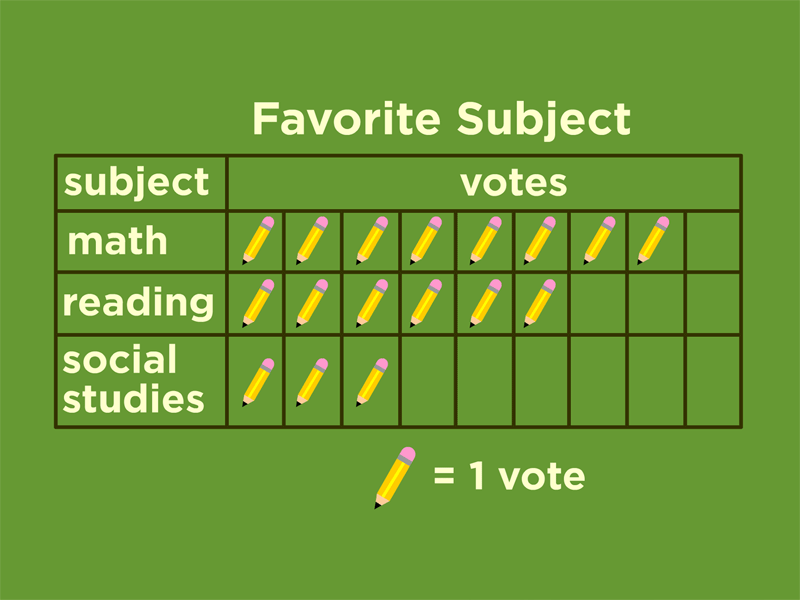
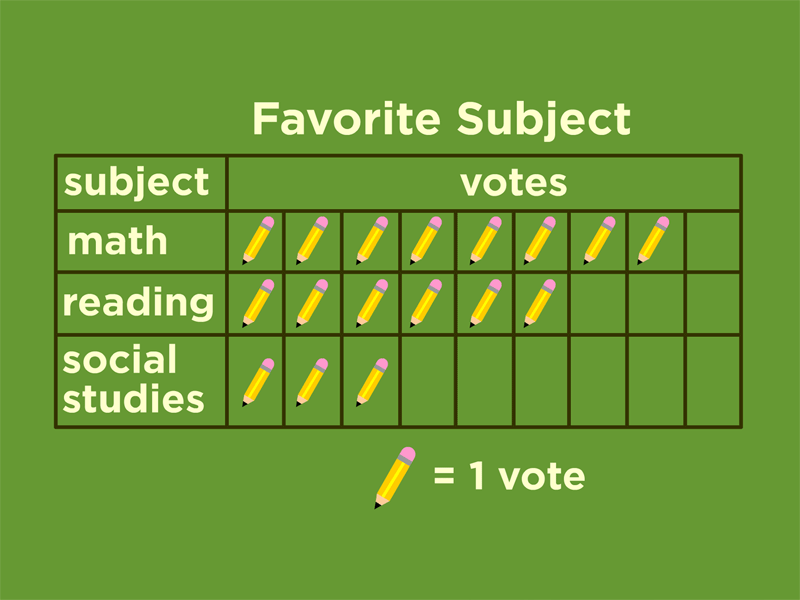
Which subject do students like the least?

a)

math

b)

reading

c)

social studies

21.

How many students ride their bicycle to school?

a)

20

b)

35

c)

30

22.

How many students ride their bicycle to school?

a)

40

b)

35

c)

30

d)

20

23.
How many students ride in a car and walk to school combined? 
a)
40
b)
50
c)
10
d)
30
24.
a)
500
b)
450
c)
400
d)
600
25.
How many total votes were collected?
a)
5
b)
10
c)
15
d)
20
26.
How many students like strawberries the best?
a)
2
b)
40
c)
20
d)
10
27.

How many balloon animals did Landon make in all on Sunday?

a)

15

b)

140

c)

150

d)

160

28.
What does each cookie equal?
a)
1 person
b)
2 people
c)
5 people
d)
10 people
29.
How many students liked basketball?
a)
4
b)
30
c)
40
d)
5
30.

How many votes did reading receive?

a)

2

b)

4

c)

6

d)

8

31.
How many students liked basketball?
a)
4
b)
30
c)
40
d)
5
32.
How many students' favorite color is blue?
a)
11
b)
12
c)
14
d)
17
33.
How many more students like soccer than hockey?
a)
29
b)
20
c)
9
d)
11
34.

How many chickens does Nate have on his farm?

a)

11

b)

12

c)

9

d)

10

35.
a)
2
b)
3
c)
4
d)
5
36.

What type of graph is this?

a)

Bar Graph

b)

Line Plot

c)

Pictograph

d)

Tally Chart

37.

How many people were polled in this survey?

a)

5 people

b)

40 people

c)

100 people

d)

145 people

38.
How many people like soccer best?
a)
5
b)
4
c)
8
d)
6
39.

How many horses does Nate have on his farm?

a)

4

b)

3

c)

2

d)

5

40.

How many students like vanilla and chocolate?

a)

8

b)

32

c)

30

d)

28

41.
What type of graph is this?
a)
bar graph
b)
pictograph
c)
tally chart
42.
Which pet got the most votes?
a)
cats
b)
dogs
c)
fish
43.
How many tally marks?
a)
9
b)
6
c)
3
d)
7
44.
How many tally marks?
a)
10
b)
15
c)
3
d)
13
45.

Which fruit got the least amount of votes?

a)

Apples

b)

Peaches

c)

Oranges

d)

Bananas

46.

How many people like soccer?

a)

7

b)

8

c)

3

d)

6

47.

How many horses are on the farm?

a)

4

b)

6

c)

1

d)

2

48.
How many tally marks?
a)
6
b)
7
c)
8
d)
9
49.
Which subject received the most votes?
a)
science
b)
reading
c)
social studies
d)
math
50.
How many students like oranges and apples?
a)
7
b)
45
c)
70
d)
20
51.
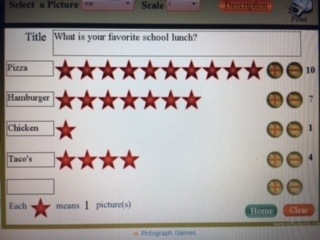
What was the favorite food?
a)
Chicken
b)
Pizza
c)
Taco's
d)
Hamburger
52.

How many strawberries does Cerise have?

a)

9

b)

7

c)

5

d)

4

53.

Which pizza was least popular?

a)

cheese

b)

mushroom

c)

sausage

d)

pepperoni

54.

How many apples were sold in Mar?

a)

2

b)

3

c)

30

d)

25

55.

The same number of pencils are sold on ____________

a)

Monday and Tuesday

b)

Wednesday and Thursday

c)

Thursday and Friday

d)

Monday and Wednesday

56.
a)
APPLE
b)
BLUE BERRY
c)
ORANGE
d)
KIWIFRUIT
57.
a)
4 MILES
b)
3 MILES
c)
5 MILES
d)
None of the above
58.
a)
10
b)
12
c)
13
d)
14
59.
a)
500
b)
450
c)
400
d)
600
60.
Information in the form of numerical figures is called _____
a)
Range
b)
Frequency
c)
Values
d)
Data
61.
What do we call the data represented in the form of pictures?
a)
Pictograph
b)
Histrogram
c)
Frequency Table
d)
None of the above
62.
Is this a bar chart or histogram?
a)
Bar chart
b)
Histogram
63.
How many students ride their bicycle to school?
a)
40
b)
35
c)
30
d)
20
64.
People buy more drinks on ____ than any other day.
a)
Monday
b)
Tuesday
c)
Thursday
d)
Friday
65.
How long did it take this object to travel 10 m?
a)
0 s
b)
10 s
c)
15 s
d)
20 s
66.
The bars used to count frequencies are called_____
a)
Tally Marks
b)
Bars
c)
Range
d)
None of the above
67.
What is the most popular mode of transport to work?
a)
Park and ride
b)
Car
c)
Walk
d)
Cycle
68.
How many people chose chicken as their favourite sandwich?
a)
7
b)
14
c)
12
d)
8
69.
How many senior boys play football and wrestle?
a)
9
b)
12
c)
18
d)
39
70.
How many students do not snowboard?
a)
21
b)
22
c)
28
d)
29
71.
How many tally marks?
a)
4
b)
5
c)
6
d)
1
72.
How many tally marks?
a)
12
b)
25
c)
15
d)
20
73.
How many students ride their bicycle to school?
a)
40
b)
35
c)
30
d)
20
74.
How many students ride in a car and walk to school combined? 
a)
40
b)
50
c)
10
d)
30
75.
Which interval shows the greatest number of pets?
a)
15-19
b)
0-4
c)
5-9
d)
10-14
76.
People buy more drinks on ____ than any other day.
a)
Monday
b)
Tuesday
c)
Thursday
d)
Friday
77.
How long did it take this object to travel 10 m?
a)
0 s
b)
10 s
c)
15 s
d)
20 s
78.
a)
9
b)
10
c)
11
d)
6
79.

Figure 2 shows five societies participated by students on a co-curricular day. How many students are there on that day?

a)

115

b)

125

c)

130

d)

135

80.

what fruit do students like the most?

(a)  

81.

which fruit do students like the least

(a)  

82.

how many more students like apples than oranges?

(a)  

83.

how many fewer like oranges then bananas?

(a)  

84.

how many students like apples and oranges?

(a)  

85.

which fruit do 7 children like?

(a)  

86.

The bar chart shows the number of students who wear spectacles and the number of students who do not wear spectacles in four Form 2 classes. Find the total number of students in Form 2 Blue class. (Write your answer in NUMBER only.)

(a)  

87.

The bar chart shows the number of students who wear spectacles and the number of students who do not wear spectacles in four Form 2 classes. Calculate the total number of students who do not wear spectacles in all the four classes.

(Write your answer in NUMBER only.)

(a)