
 Worksheets
Unit 6 Review
Total questions: 41
Worksheet time: 43mins

The number of points in the first 5 games of the basketball season are listed below. What is the mean number of points scored?
16 pts
33 pts
32 pts
31.6 pts

Students record the number of minutes they read at home. The box plot shows the summary of the results. Which statement best describes the data?
A quarter of the students read for 30-40 minutes.
The interquartile range is 30.
About half the students read for 50 minutes or more.
The average number of minutes read was 47.

The dot plot shows the number of hours the students in Mrs. Ferro's class volunteer each month. Which of the following statements is NOT correct?
There are a total of 17 students in Mrs. Ferro's class.
Exactly 7 students volunteered for less than 7 hours.
Less than half of the students volunteer for 9 hours or more.
The mode is 6 and 10.

Based on the box plot, which statement is NOT true?
The oldest team member is 24.
The median age is 22.
Fifty percent of the participants are older than 22.
Less than 25% of the participants are 20 or younger.

The dot plot below represents the number of dollars in allowance that students receive each week in Mrs. Jimenez's class. What is the median amount of allowance?
5
6
8
7.5

The data below represents the different costs of monthly internet service. What is the mean?
$330
$50
$48
$55

The box plot below shows the number of siblings in Mrs. Hines' class. Which of the following statements is NOT true?
The interquartile range of the data is approximately 2.
The median number of siblings in Mrs. Hines' class is approximately 1.75.
There is at least one students who has no siblings.
Over half of the students in Mrs. Hines' class have two or more siblings.

12,10,10,10,13,12,11,13,10


Which statement is true about a box plot where the length of the left box and left whisker is the SAME length as the right box and right whisker?
The right half of the data is more clustered than the left half.
The upper extreme and the lower extreme are the same.
Both halves of the data have an equal spread.
There are no outliers.

Which statement is best supported by the box plot?
The mean of the data is 85.
There were 98 students included in the data.
The median of the data is 85.
Half of the students scored between 68 and 94.

Which statement about the data in the histogram is true?
The distribution of the data is symmetrical, so the mean and the median are most likely the same value.
The distribution of the data is symmetrical, so the mean and the median are most likely different values.
The distribution of the data is skewed, so the mean and the median are most likely the same value.
The distribution of the data is skewed, so the mean and the median are most likely different values.
The mean should be used as the measure of center if the data is skewed.
True
False
When the mean and the median are the same or almost the same value, the distribution is said to be symmetric.
True
False
Of the mean, median, and mode, the median will always be the most affected by outliers.
True
False
If the data does not resemble a mirror image, the distribution is said to be skewed.
True
False

Which statement best describes the shape of the data distributions?
Graph 1 is skewed and Graph 2 is symmetrical.
Graph 1 is symmetrical and Graph 2 is skewed.
Graph 1 and Graph 2 are both symmetrical.
Graph 1 and Graph 2 are both skewed.
(draw a line down the middle and both sides look the same)
(draw a line down the middle and both sides look the same)
(draw a line down the middle and both sides look the same)



23, 34, 27, 7, 30, 26, 28, 31, 34

What is true about the histogram?
The tallest black cherry trees are between 85 and 90 feet in height. The data is not symmetrical. The range is 90 - 60 = 30 feet.
The heights of the trees are distributed symmetrically.
There is an outlier of 90 feet. The range is 10 - 0 = 10.
The tallest black cherry trees are between 75 and 80 feet in height and the data is symmetrical. The outlier is 60 feet.


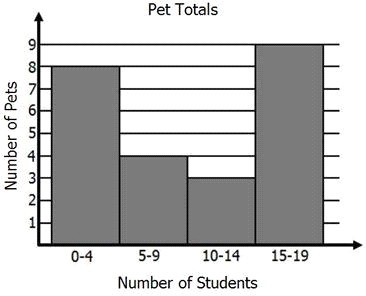
What pets does our class have?
Is the following question statistical or non statistical?
How many students like the color blue?
Statistical
Non Statistical
How tall are the students in our class?
Is the following question statistical or non statistical?
How many students in our school prefer chocolate chip over oatmeal raisin?
Statistical
Non Statistical

