
 Worksheets
Python Quiz-2.2
Total questions: 12
Worksheet time: 7mins
To add a title in the chart we use the function?
title("title of the chart")
plt.title("title of the chart")
plt.title(title of the chart)
Which code should we use to display our graphs?
plt.display()
plt.graph()
plt.show()
plt.chart()
pyplot is also a python library?
False
True
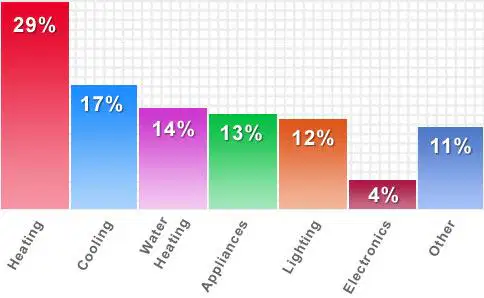
This is an example of a ___________.
Scatter Chart
Bar Graph
Line Graph
Pie Chart
We can use matplotlib without installing the library.
True
False
To create a chart, pyplot provides
create()
plot()
chart()
figure()
To display histogram with well-defined edge we can write
df.plot( type = ‘hist’, edge = ‘red’)
df.plot( type = ‘hist’, line = ‘red’)
df.plot( type = ‘hist’, edgecolor = ‘red’)
df.plot(type = ‘hist’, linecolor = ‘red’)
By default, Plot() function plots a
Bar chart
Line chart
Pie chart
Horizontal bar chart
Seaborn is python _________library based on matplotlib.
Graphicial interface
Data visualization
Statistical graph
Data structure
Seaborn provides a high level interface for
drawing attractive
graphic tools
statistical graph
statistical bar
Find the Features of Seaborn
Seaborn works well with NumPy and Pandas data structures
It come with Tools for choosing color palettes to make beautiful plots
It helps to visualize univariate and bivariate data
It deals like how one varibale is behaving with respect to other
Seaborn helps to plot statistical time series data with flexible estimation and representation of uncertainty around the estimate?
True
False

