
 Worksheets
Graphs and surveys
Total questions: 12
Worksheet time: 24mins
Name
Class
Date
1.
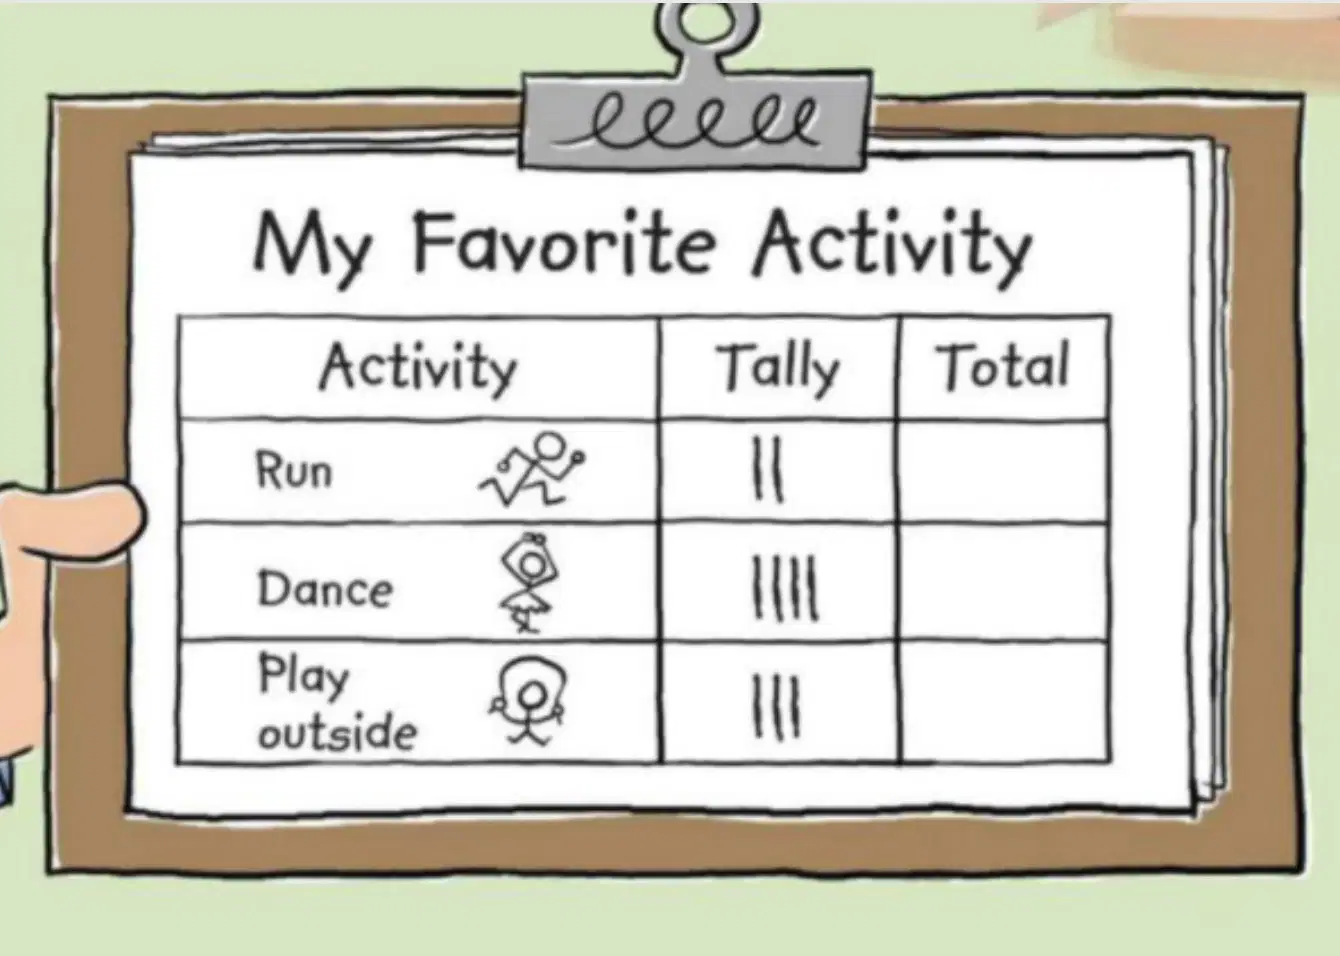
What is this?
a)
A picture graph.
b)
A tally chart.
c)
A bar graph.
d)
Miss Amaya’s house.
2.

How many people picked run?
a)
0
b)
1
c)
2
d)
3
3.
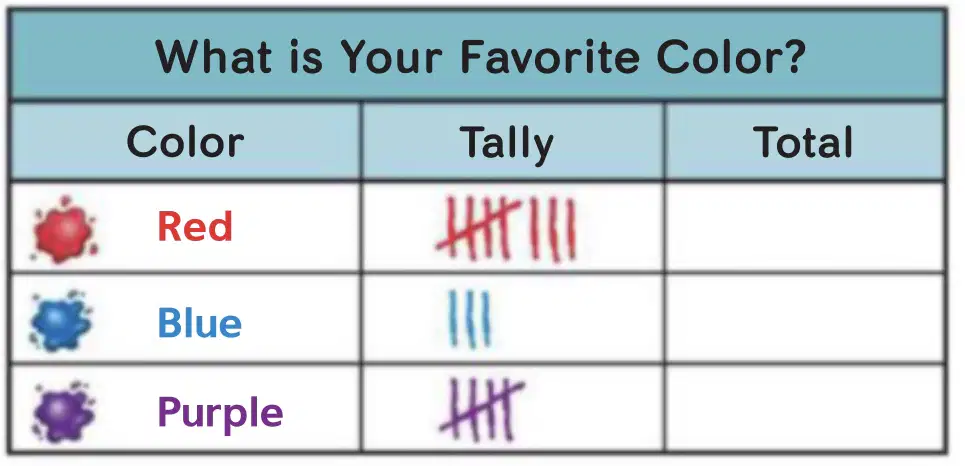
How many more people chose red than blue?
a)
3
b)
5
c)
8
4.
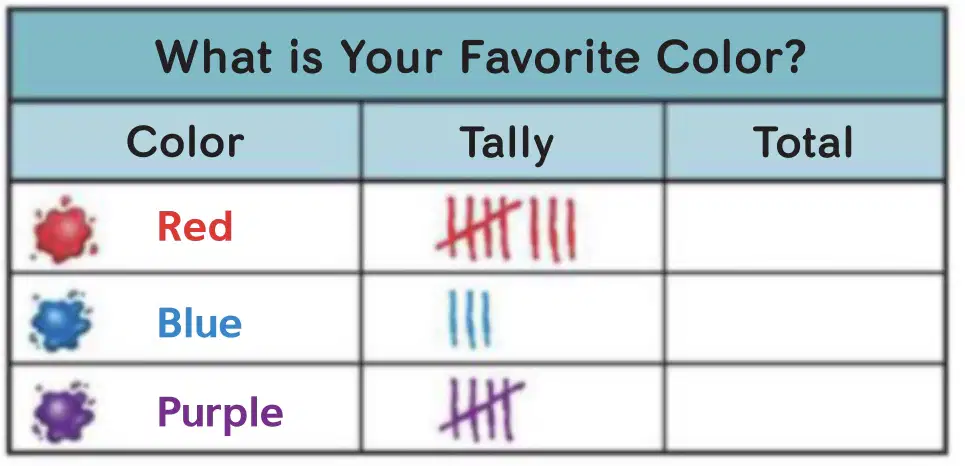
How many people voted in all?
a)
8
b)
10
c)
13
d)
16
5.
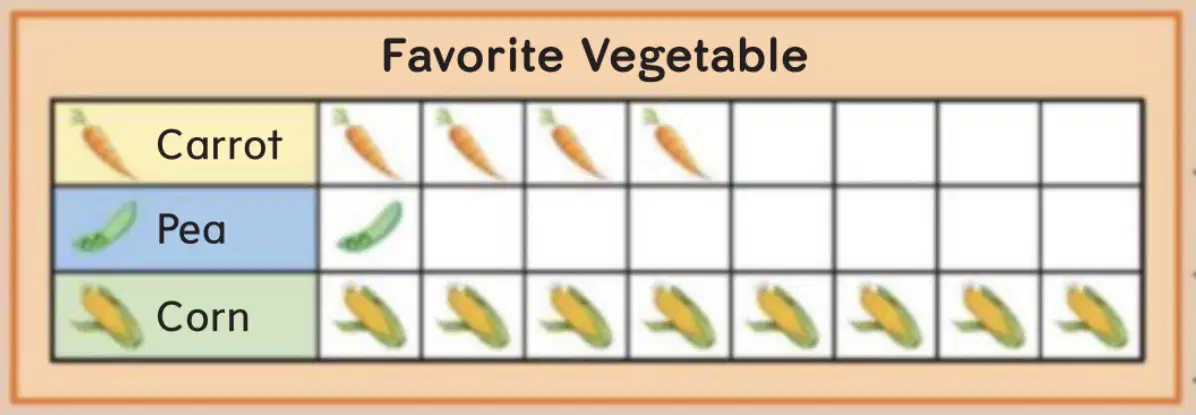
What is this?
a)
A tally chart.
b)
A picture graph.
c)
A bar graph.
6.
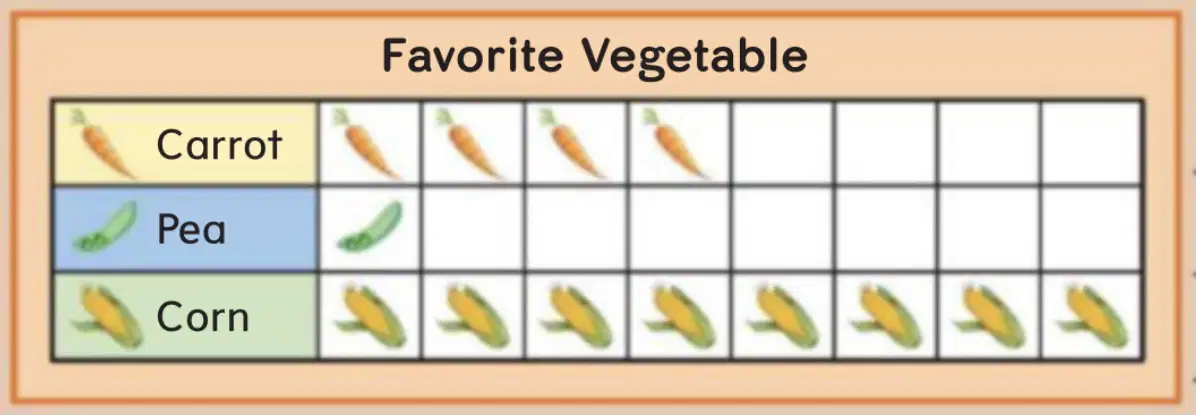
Which vegetable has the most votes?
a)
Carrot 🥕
b)
Pea
c)
Corn 🌽
7.
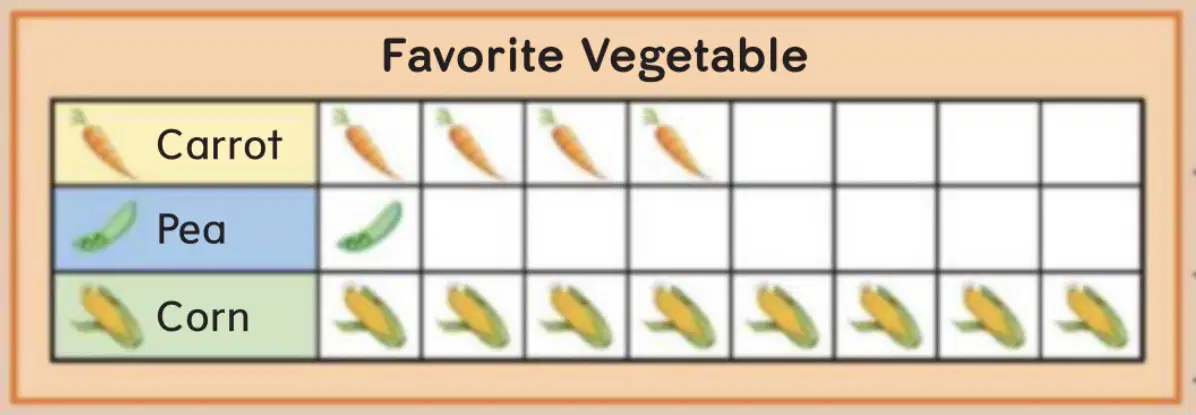
How many more votes does corn have than pea?
a)
7
b)
1
c)
8
8.
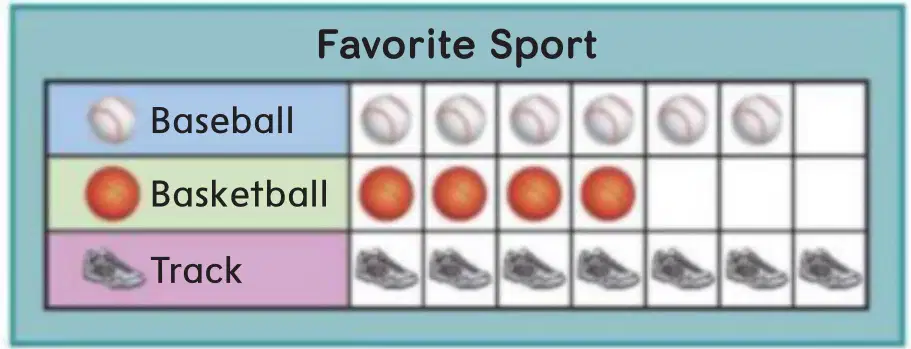
How many fewer people voted for basketball than baseball?
a)
1
b)
2
c)
3
9.
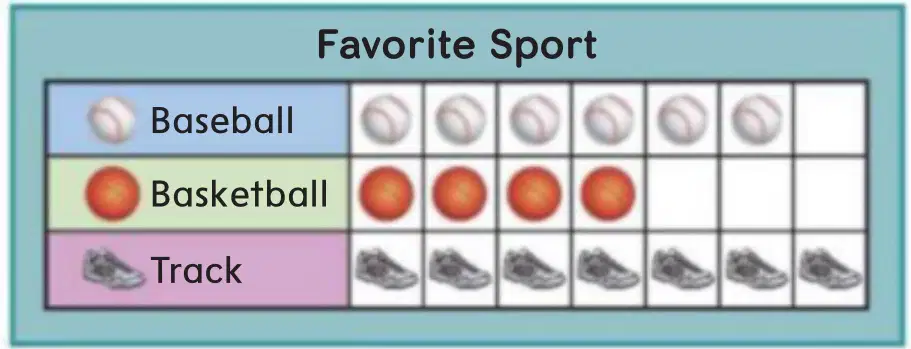
What does this picture graph show?
4 lines
10.

What is this?
a)
A tally chart.
b)
A picture graph.
c)
A bar graph.
11.
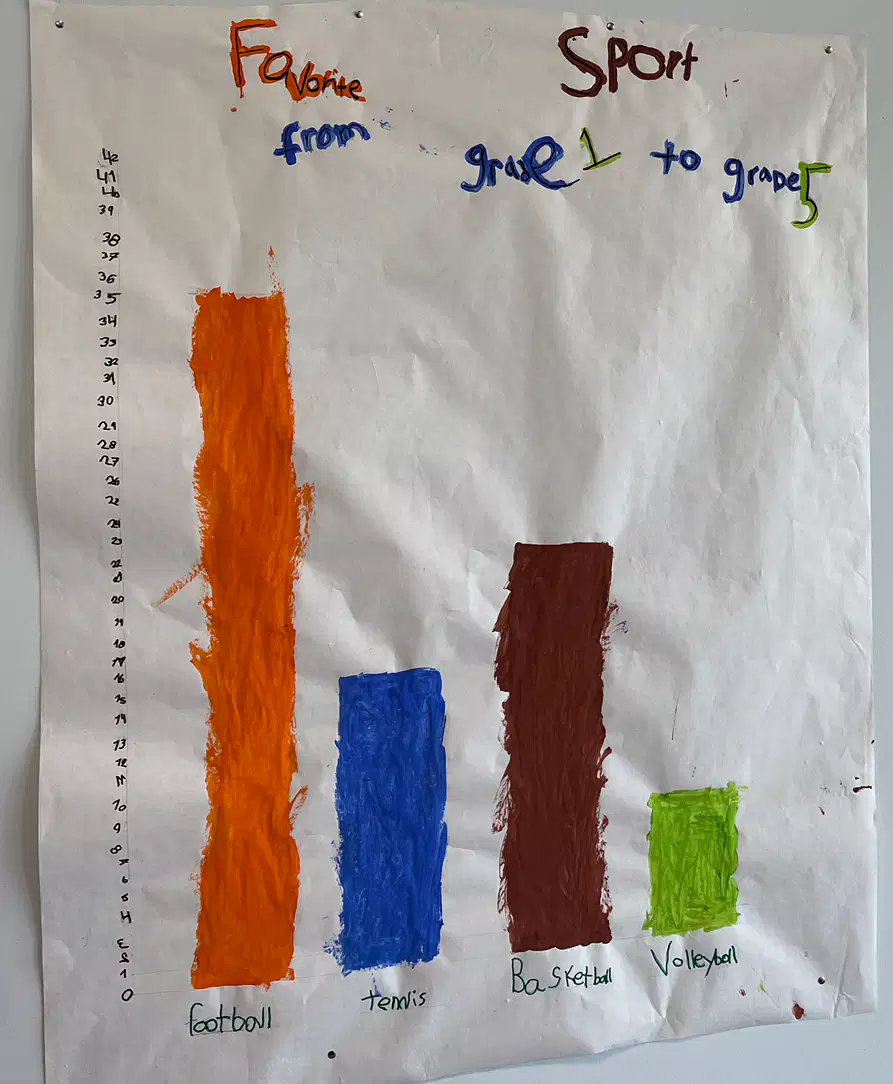
Which sport had the fewest votes?
a)
Football/soccer
b)
Tennis
c)
Basketball
d)
Volleyball
12.

What is this?
a)
A tally chart.
b)
A picture graph.
c)
A bar graph.
100 %

