
 Worksheets
G6 Data handling-1
Total questions: 20
Worksheet time: 10mins
Data obtained in original form is called raw data




How many matches got 3 goals?
2
3
4
5

How many more cakes on Wednesday and Thursday?
10 cakes
25 cakes
20 cakes
15 cakes

What animal has least likes?
budgie
rabbit
lizard
hamster

Rozi collected data about his classmate favourite animal. How many friends who likes parrot as pet?
10
7
12
11

How many people loved decorating the tree???
9
5
6
3

Look at the given tally marks chart. How many birds did Sara count on Friday?
5
7
6

This tally chart shows learners' favourite animals.
How many learners like Tiger and Deer?
25
26
15

32 people went to a ice hockey match. The pie chart shows the colours of their shirts. How many people wore black?
45
1
4
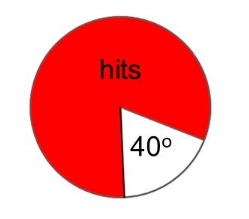
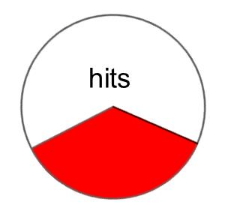
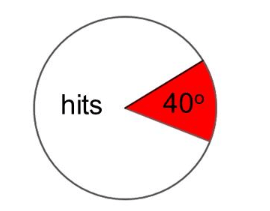
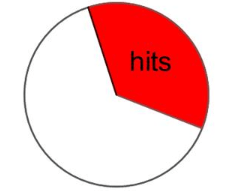
A darts player hits his target 40% of the time. Which pie chart represents his hits and misses?

What is the ratio of tables to chairs?
3:1
3:4
360270

The pie chart shows colours of motorbikes in a shop. There are 20 more blue bikes than white. How many bikes are there altogether?
54
160
40
80

These pie charts show how people travel to work in 2 towns. In which town do more people travel to work by bike?
town A
town B
both the same
impossible to say

