
 Worksheets
Data Handling and Representation
Total questions: 20
Worksheet time: 11mins
Name
Class
Date
1.
Representation of Data using rectangles of uniform width and equal spacing between them is called:
a)
Tabular Form
b)
Bar Graph
c)
Pictograph
d)
None of the above
2.

a)
4 MILES
b)
3 MILES
c)
5 MILES
d)
None of the above
3.

What is this type of graph called?
a)
Line plot
b)
Bar graph
c)
Pictograph
4.
What percentage does a whole circle graph represent?
a)
360%
b)
90%
c)
50%
d)
100%
5.

How many senior boys play football but do not wrestle?
a)
26
b)
8
c)
104
d)
16
6.

How many students like Soccer or Hockey or Golf?
a)
69
b)
36
c)
33
d)
2
7.

How many students only like Soccer ?
a)
11
b)
29
c)
18
d)
45
8.

How many students do not like either Soccer or Golf or Hockey?
a)
16
b)
2
c)
33
d)
36
9.

How many people ate pepperoni pizza for lunch?
a)
15
b)
21
c)
6
d)
12
10.

How many students do not snowboard?
a)
21
b)
22
c)
28
d)
29
11.

What does the shaded portion of the Venn diagram represent?
a)
Not p
b)
p
c)
p and q
d)
p or q
12.

What does the shaded portion of the Venn diagram represent?
a)
Not p
b)
p or q
c)
p and q
d)
Not q
13.

What does the shaded portion of the Venn diagram represent?
a)
Band and Art
b)
Only Art
c)
Band or Art
d)
Neither
14.

What does the shaded region of the Venn diagram represent?
a)
P or S
b)
Only P or S
c)
P and S
d)
Only P and S
15.

How many shape HAS CURVED LINES and HAS MORE THAN TRHEE SIDES?
a)
2
b)
0
c)
3
16.
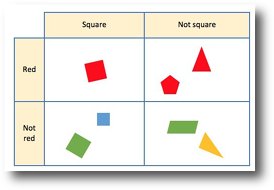
How many squares are there?
a)
1
b)
2
c)
3
d)
4
17.

How many people can swim?
a)
5
b)
6
c)
8
d)
9
18.

How many students like Vanilla and Chocolate?
a)
8
b)
30
c)
32
d)
28
19.

Mention the criteria of Blue Oval
a)
Shapes with curved lines/ Blue shape
b)
Shapes with curved lines / Pink shape
20.

Look at the Carroll diagram.
There are .... children cannot swim.
a)
3
b)
5
c)
6
d)
7
100 %

