wayground logo

Free Printable Worksheets

Font size

S
M
L
XL
Worksheets

Question Bank for Grade 6 Mathematics

Total questions: 203

Worksheet time: 8hrs 39mins

Name
Class
Date
1.
At Donald's Donuts the number of donut holes in a bag can vary. Help Donald find the mode.
12,10,10,10,13,12,11,13,10
a)
13
b)
12
c)
11
d)
10
2.
Find the mean of these numbers:
2, 57, 38, 42, 6
a)
29
b)
38
c)
50
d)
145
3.
Identify the outlier for the given data?
23, 34, 27, 7, 30, 26, 28, 31, 34
a)
7
b)
23
c)
31
d)
34
4.
To find the _________ you add up all the numbers and then divide by how many numbers you have.
a)
Mean
b)
Median
c)
Mode
d)
Range
5.
To find the ______ you put all numbers in order from least to greatest and then take the largest number minus the smallest number.
a)
Mean
b)
Median
c)
Mode
d)
Range
6.
To find the ________ you put all numbers in order from least to greatest and find the number that is in the middle.
a)
Mean
b)
Median
c)
Mode
d)
Range
7.
Find the median.
12, 5, 9, 18, 22, 25, 5
a)
9
b)
8
c)
12
d)
18
8.
A data set can have more than one mode
a)
True
b)
False
9.
A data set can have more than one median?
a)
True
b)
False
10.
Find the Mean of:
8, 14, 32, 6, 15
a)
15
b)
175
c)
75
d)
12
11.
What is the median of:
6, 12, 16, 11, 8, 4, 1, 11, 4
a)
11
b)
6
c)
8
d)
7
12.
The mode score on the 6th grade math test was 94! Which of these interpretations must be correct?
a)
99 was the highest score on the test.
b)
More students received a 94 than any other score
c)
No student scored below a 50
d)
A score of 91 was slightly below average.
13.

What is another word for AVERAGE?

a)

Mode

b)

Median

c)

Mean

d)

Not nice

14.

What is the mode?

a)

the number that occurs the most in a data set

b)

the middle number in the data

c)

the average of all the numbers

d)

the range of the data

15.

What's another word for median?

a)

average

b)

mode

c)

middle

d)

mean

16.

In the data set below, which measure of center would best describe the data?

0 , 1 , 0 , 14 , 1 , 0 , 0 , 0 , 0 , 2 , 0 , 0 , 0

a)

the median

b)

the mode

c)

the mean

d)

this answer is impossible to know

17.

how many people voted in this dot plot

a)

4

b)

9

c)

3

d)

not here

18.
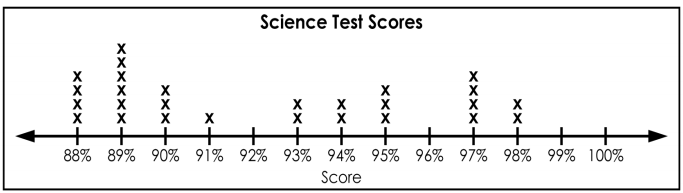
How many students received a score of 94%? 
a)
94
b)
4
c)
1
d)
2
19.
What is the highest score in the class?
a)
88%
b)
100%
c)
13
d)
98%
20.
How many students received a score in the 90s?
a)
6
b)
2
c)
91%
d)
17
21.
How many total students are in the science class?
a)
13
b)
6
c)
27
d)
25
22.
What is the difference between the highest score and the lowest score on the test?
a)
15
b)
100
c)
6
d)
10
23.
How many people have two or less books in their desk?
a)
4
b)
5
c)
6
d)
7
24.
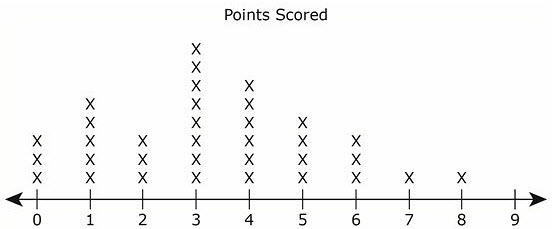
The dot plot below shows the points scored by players in a basketball game.

What is the difference between the number of players who scored fewer than 4 points and the number of players who scored more than 4 points?
a)
4 players
b)
10 players
c)
13 players
d)
15 players
25.
Which car club attends more car shows?
a)
Cruisers
b)
Car Hops
26.
How many more students scored a 88 than scored a 98?
a)
4
b)
2
c)
6
d)
35
27.

Which three ages combined have the highest number of students

a)

6.7.8

b)

8,9,10

c)

10,11,12

d)

4,5,6

28.

What is the range for this data set? Remember to subtract the minimum value from the maximum value.

a)

10

b)

15

c)

25

d)

30

29.

What is the median for this data set? Remember to rank the data in order from least to greatest, then find the median, which is the middle number in the ranked set of data.

a)

55

b)

60

c)

70

d)

75

30.

What is the mean (average) for this data set? Remember to add all of the data then divide by the total number of data collected.

a)

60

b)

62

c)

64

d)

66

31.

What is the mode for this data set? Remember the mode is the most common or most frequent data.

a)

150

b)

170

c)

180

d)

190

32.

A question that asks about a set of data is called a ________________________.

a)

attribute

b)

frequency

c)

statistical question

d)

data

33.
Is the following question statistical or non statistical?
On average, how many water bottles does every class go through daily?
a)
Statistical
b)
Non Statistical
34.
Is the following question statistical or non statistical?
How many cars are in the parking lot?
a)
Statsitical
b)
Non Statistical
35.

Is the following question statistical or non statistical?

How many students in our school prefer chocolate chip over oatmeal raisin?

a)

Statistical

b)

Non Statistical

36.

This is a

a)

dot plot

b)

frequency table

c)

relative frequency table

d)

histogram

37.

What is the outlier for this data?

a)

90

b)

96

c)

102

d)

108

38.
Are these dot plots symmetric?
a)
Yes
b)
No
39.
Is the Cars dot plot skewed left or right?
a)
left
b)
right
40.

What shape is the dot plot for SUV's?

a)

skewed right

b)

skewed left

c)

symmetrical

d)

none of the above

41.

What is the median of the data?

a)

2

b)

1

c)

3

d)

12

42.
What is the MEDIAN of this data?
a)
65
b)
40
c)
915
d)
13
43.

What is the highest score in the class?

a)

88%

b)

100%

c)

13

d)

98%

44.
How many ladies from age 40-50 visited the library?
a)
8
b)
6
c)
7
d)
9
45.
How many students have 0 Brothers and Sisters? 
a)
6 students
b)
0 students
c)
12 students
d)
10 students
46.

How many people exercised for at least 3 hours?

a)

2

b)

7

c)

6

d)

3

47.

What was the median number of hours spent playing video games?

a)

5

b)

6

c)

7

d)

9

48.

What does point C on the box plot represent?

a)

First Quartile

b)

Median

c)

Third Quartile

d)

Mean

49.

What do points B and D represent on the box plot?

a)

Mean and Mode

b)

Mean and Median

c)

Least and Greatest Value

d)

First and Third Quartiles

50.

What do points A and E represent on the box plot?

a)

Mean and Mode

b)

Mean and Median

c)

Least and Greatest Value

d)

First and Third Quartiles

51.

What is the median of this data set?

a)

8

b)

12

c)

15

d)

19

52.

What is the least and greatest value of this data set?

a)

6 and 8

b)

6 and 19

c)

8 and 15

d)

15 and 19

53.

What is the range of this data set?

a)

6

b)

12

c)

13

d)

19

54.

Data points in the first quartile are between which two points?

a)

6 and 8

b)

8 and 12

c)

12 and 15

d)

15 and 19

55.

What is the Interquartile Range of this data set? The lower (first) quartile is 19 and the upper (3rd) quartile is 56.

a)

75

b)

37

c)

72

56.

Interquartile Range is

a)

the difference between the third quartile and the first quartile

b)

the difference between the greatest and least data values.

57.

Range is

a)

the difference between the third quartile and the first quartile

b)

the difference between the greatest and least data values.

58.
What is the interquartile range?
a)
4
b)
6
c)
2
d)
8
59.
What value is the lower quartile?
a)
66
b)
58
c)
60
d)
64
60.
What do you do if there are two numbers in "the middle" when you are finding the median?
a)
Pick your favorite number
b)
Add the two numbers in the middle & then divide by two.
c)
They are both the median
d)
None of the above
61.
What percent of students have a height between 58 inches and 60 inches?
a)
25%
b)
50%
c)
75%
d)
100%
62.
What percentage of the data is between 90 and 140?
a)
25 %
b)
50%
c)
75%
d)
100%
63.

What is the upper quartile of the set of data; 2, 4, 6, 6, 7, 8, 10

a)

4

b)

6

c)

8

d)

2

64.

Determine the IQR for this set of data. 12, 13, 14, 15, 17, 18, 19, 19, 22, 23

a)

14

b)

5

c)

17.5

d)

19

65.
a)

The median test score is 80.

b)

The lower quartile is 65.

c)

The upper quartile is 90.

d)

The IQR is 30.

66.

What is the interquartile range (IQR)?

a)

20

b)

25

c)

30

d)

50

67.
Which city has a lower IQR?
a)
City A
b)
City B
68.
Which box and whisker plot has the highest median?
a)
Top plot
b)
Bottom plot
69.
Which box and whisker plot has the smallest lower quartile?
a)
Top plot
b)
Bottom plot
70.
Which box and whisker plot shows more "spread out" data?
a)
Top plot
b)
Bottom plot
71.
What percent of students have heights between 60 inches and 66 inches?
a)
75%
b)
50%
c)
100%
d)
25%
72.
6. Which city has a higher median?
a)
Millersburg
b)
Arcadia
73.
True of false, 75% of the data values are greater than 18?
a)
True
b)
False, 75% of the values are greater than 16
c)
False, 50 % of the values are greater than 18
d)
False, 25% of the values are greater than 18
74.

Which plot has a median of 50?

a)

Plot 1

b)

Plot 2

c)

Plot 3

d)

Plot 4

75.

Which box and whisker plot has an upper extreme of 100?

a)

Plot 1

b)

Plot 2

c)

Plot 3

d)

Plot 4

76.
a)

A. Mean and Mode

b)

B. Mean and Median

c)

C. Least and Greatest Value

d)

D. Lower and Upper Quartile

77.
What type of graph is this?
a)
Bar Graph
b)
Histogram
c)
Line Plot
78.
Which interval has 400 employees?
a)
33-43
b)
0-10
c)
77-87
d)
66-76
79.
How many cities have temperatures between 70 degrees and 99 degrees?
a)
44
b)
34
c)
26
d)
62
80.
How many students are between 48 and 51 inches tall?
a)
14
b)
8
c)
2
d)
0
81.
How many students scored between a 86 and a 90?
a)
1
b)
3
c)
6
d)
10
82.
How many students have more than 1,000 songs on their MP3 player?
a)
5
b)
16
c)
10
d)
4
83.
Which interval shows the greatest number of pets?
a)
15-19
b)
0-4
c)
5-9
d)
10-14
84.
Mr. Semo is making a histogram to show the scores on the last science test. He first lists the scores in a stem-and-leaf plot. How many units tall should the bar be for the interval 70-79?
a)
2
b)
5
c)
9
d)
11
85.
Is this an example of a histogram?
a)
yes
b)
no
86.
This is a histogram
a)
true
b)
false
87.
What percent of students have less than 1,000 songs on their MP3 players?
a)
15%
b)
80%
c)
20%
d)
45%
88.

If Maria wants to know the median of a set of data, which type of graph should she look at?

a)

histogram because it shows each piece of data

b)

line plot because it shows each piece of data

c)

histogram because the median is always the tallest bar

d)

line plot because the median is always the number with the most dots

89.
Elliot says almost everyone arrived at the party after 10:00 P.M., but Nancy thinks most people came earlier. When did a majority of the people arrive? 
a)
7:00-7:59 P.M.
b)
8:00–8:59 P.M.
c)
9:00–9:59 P.M.
d)
10:00–10:59 P.M. 
90.
What is incorrect about the following histogram?
a)
The intervals are too small
b)
The intervals overlap
c)
The graph does not start at 0
d)
The axes are not labeled.
91.

What percent of the of the students have 2,000 or more songs?

a)

36%

b)

9%

c)

45%

d)

36%

92.
Is a histogram the same as a bar graph?
a)
Yes, because they both use intervals.
b)
No, because a histogram displays numerical data while a bar graph displays categorical data.
c)
Yes, because they both use bars to display data.
d)
No, because a histogram displays categorical data while a bar graph displays numerical data.
93.
What is an interval?
a)
A single number
b)
A range of numbers
c)
A percentage
d)
A total amount
94.
Raul measured the heights of the apple trees in an orchard.
What percent of the trees are 5-9 feet tall?
a)
18.9%
b)
31%
c)
22.1%
d)
10%
95.
What was the exact price most people payed for a gallon of gas?
a)
$2.10
b)
$1.95
c)
$2.03
d)
We can not tell using the histogram
96.

How many trees are at least 15 feet tall?

a)

12 trees

b)

2 trees

c)

9 trees

d)

41 trees

97.

Raul measured the heights of the apple trees in an orchard.

ABOUT what percent of the trees are 5-9 feet tall?

a)

19%

b)

31%

c)

50%

d)

10%

98.
What percent of students have less than 1,000 songs on their MP3 players?
a)
15%
b)
80%
c)
20%
d)
45%
99.
Is the following question statistical or non statistical?
How many ceiling tiles are in our classroom?
a)
Statistical
b)
Non Statistical
100.
Is the following question statistical or non statistical?
How tall are the students in our class?
a)
Statistical
b)
Non Statistical
101.

0.87 + 6.12

a)

6.99

b)

10.25

c)

6.989

d)

9.66

102.

43.68 - 40.67

a)

3.01

b)

3.1

c)

30.1

d)

3.11

103.

What sign completes the question?

a)

>

b)

<

c)

=

104.

Put these integers in order from least to greatest.

a)

8,4,1,0,-3,-6

b)

8,4,1,0,-6,-3

c)

-6,-3,0,1,4,8

d)

-3,-6,0,1,4,8

105.

Put these integers in order from least to greatest.

a)

-7,-13,-65,7,34,55,62

b)

-65,-13,-7,7,34,55,62

c)

-7,7,-13,34,55,62,-65

d)

62,55,34,7,-7,-13,-62

106.
1/2 divided by 3/4
a)
3/2
b)
2/3
c)
1 1/2
d)
3/8
107.

What is the rule for dividing fractions?

a)

keep, change, opposite

b)

keep, change, flip (reciprocal)

c)

keep, keep, change

d)

keep, keep, opposite

108.
What is the recriprocal of 5
a)
5/1
b)
1/5
109.
What is the recriprocal of 4/5
a)
4/5
b)
5/4
c)
5/1
d)
1/5
110.
9 divided by 3/4 equals _____.
a)
36
b)
12
c)
14
d)
9
111.

What is another name for flip as it relates to dividing fractions?

a)

dolphin

b)

reciprocal

c)

behind

112.

What integer would represent a withdrawal of $19.43 at a bank?

a)

19.43

b)

-19.43

113.

What integer would represent losing 15 points be represented?

a)

15

b)

-15

114.

What integer would a bank use to represent a deposit of $126.49?

a)

126.40

b)

-126.40

115.

What integer would represent a roller coaster that is 3 meters below ground?

a)

3

b)

-3

116.

What integer would represent gaining 12 points?

a)

12

b)

-12

117.

What integer would represent a point 7 1/4 meters above sea level?

a)

7 1/4

b)

-7 1/4

118.

What integer would represent a temperature that is 11 degrees below zero?

a)

11

b)

-11

c)

0

119.
What inequality does the number line graph represent?
a)
x > 5
b)
x < −5
c)
x ≥ 5
d)
x ≥ −5
120.
When you graph an inequality, you use a closed dot when you use which symbols?
a)
≤, ≥ 
b)
<, >
c)
≤, <
d)
≥, >
121.
Match the graph with its inequality.
a)
a > 11
b)
a < 11
c)
a ≥ 11
d)
a ≤ 11
122.
When graphing an inequality, you use an open dot when you use which symbol?
a)
<, >
b)
≤, ≥ 
c)
≤, <
d)
≥, >
123.
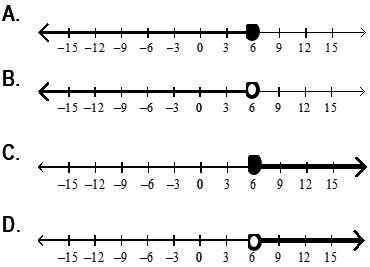
Pick the correct letter for:
6 > x
a)
A
b)
B
c)
C
d)
D
124.
Which inequality matches the graph?
a)
A
b)
B
c)
C
d)
D
125.
What inequality does the number line graph represent?
a)
x ≤ -4
b)
x ≥ -4
c)
x < -4
d)
x < 4
126.
What is the solution for x + 9 = 21
a)
10
b)
12
c)
11
d)
13
127.
a)
x = 20
b)
x = 7
c)
x = 10
d)
x = 3
128.
m+13=21
a)
m=34
b)
m=8
c)
m=273
d)
m=6
129.
Solve for y:
y - 7 = 10
a)
17
b)
-3
c)
3
d)
-17
130.
Write the expression.
Twelve fewer questions than were on the first test. 
a)
12 + q
b)
q - 12
c)
q x 12
d)
q ÷ 12
131.
Write the expression. 
Twelve times the number of feet.
a)
f + 12
b)
f - 12
c)
12f
d)
12 ÷ f
132.
If y=4,find the value of 3y+5
a)
27
b)
12
c)
17
133.
(7 + 41) ÷ 2 – 15 =
a)
19
b)
9
c)
25
d)
3
134.
10 + 45 ÷ 9 -(14 ÷ 2)  = 
a)
9
b)
8
c)
53
d)
18
135.
What are the steps to solve the following expression?
50 − 16 ÷ 2
a)
add, multiply
b)
subtract, divide
c)
divide, subtract
d)
subtract, multiply
136.
2(c - 8)
a)
2c - 16
b)
2c + 16
c)
2c - 8
d)
c - 16
137.

What is the simplified version of this expression?  7(5x1)7\left(5x-1\right)  

a)

 35x+735x+7  

b)

 35x135x-1  

c)

 35x735x-7  

d)

 35x7-35x-7  

138.
GCF of 24 and 56
a)
2
b)
4
c)
6
d)
8
139.

If a = 8, b = 4, and c = 10, what is a(b + c)?

a)

22

b)

320

c)

112

d)

2560

140.

If m = 9, what is 4m + 2m?

a)

54

b)

24

c)

78

d)

18

141.
Which figure shows the inequality x > -4?
a)
Figure 1
b)
Figure 2
c)
Figure 3
d)
Figure 4
142.
s - 10 ≤ 1
a)
s ≤ 11
b)
s ≤ 9
c)
s ≥ 11
d)
s ≥ 9
143.

Solve the inequality.

30 + n ≥ 50

a)

n ≥ 50

b)

x ≥ 80

c)

n ≤ 30

d)

n ≥ 20

144.
Solve the inequality.
x + 5 ≤ 13
a)
x ≥ 8
b)
x ≥ 18
c)
x ≤ 8 
d)
x ≤ 18 
145.
Write an inequality
Tom has to have at least 15 people to go to his birthday party
a)
x<15
b)
x>15
c)
x≤15
d)
x≥15
146.
Match:
You must be at least 48 inches tall to ride the bumper cars.
a)
h < 48
b)
h > 48
c)
h ≤ 48
d)
h ≥ 48
147.
Write an inequality 
Bob needs at most 10 to go to the movies
a)
x<10
b)
x>10
c)
x≤10
d)
x≥10
148.
Match:
The postal scale will weigh a maximum of 50 lbs.
a)
 p < 50
b)
p > 50
c)
p ≤ 50
d)
p ≥ 50
149.
Find the GCF of 64 and 144
a)
8
b)
6
c)
16
d)
2
150.
What is the GCF of 4 and 12?
a)
3
b)
1
c)
6
d)
4
151.

Which list orders the integers from least to greatest?

a)

-5, 3, -2, l -4l

b)

-2, 3, l-4l, -5

c)

-5, -2, 3, l-4l

d)

-2, -5, 3, l-4l

152.

Which represents the absolute value of 10?

a)

10

b)

-10

c)

-1/10

d)

11

153.

Evaluate the following expression

I -3 I

a)

0

b)

3

c)

-3

d)

.3

154.

What does absolute value mean?

a)

The opposite of a number

b)

The exact distance a number is from zero

c)

a negative plus a positive

155.

Absolute value is always a ____________

a)

positive

b)

negative

c)

inequality

d)

rational number

156.

The opposite of a negative is always a ___________

a)

positive

b)

negative

c)

absolute value

d)

inequality

157.

What does absolute value mean?

a)

The opposite of a number

b)

The exact distance a number is from zero

c)

a negative plus a positive

158.

What is the opposite of -36

a)

36

b)

-36

c)

3.6

d)

-3.6

159.

What is the opposite of 360?

a)

360

b)

-360

c)

0

160.

Is the absolute value the same for both of the following numbers?

I 7 I and I -7 I

a)

yes they both have an absolute value of 7

b)

yes, they both have an absolute value of -7

c)

no

161.
Which letter matches the coordinate (4, -6)?
a)
G
b)
Z
c)
K
d)
None of the above
162.
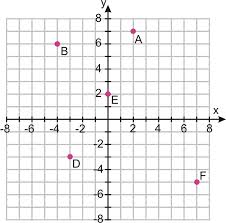
Where is point E located?
a)
( 2, 0 )
b)
( 2 , 2 )
c)
( 0 , 2 )
d)
( 0 , 0 )
163.
Give the coordinates for POINT H.
a)
(-1, 2)
b)
(1, -2)
c)
(-1, -2)
d)
(1 , 2)
164.
If you were to plot the point (4, -12) what would be the correct method?
a)
Up 4, left 12
b)
Right 4, up 12
c)
Down 4, left 12
d)
Right 4, down 12
165.
When plotting points in a coordinate plane, which directions should you go first? 
a)
left or right
b)
up or down
c)
left
d)
up
166.

In the ordered pair, (7, -7), first I would move ____ then ____.

a)

Left, Down

b)

Left, Up

c)

Right , Up

d)

Right , Down

167.
The cookie jar has six chocolate chip cookies and five oatmeal cookies. What is the ratio of oatmeal to chocolate chip cookies?
a)
6:5
b)
5:6
c)
6:11
d)
6:11
168.
Enter the missing numbers to create equivalent ratios. 
1 : 3
6 : 18
2 : _
4 : _
a)
4 & 8
b)
4 & 12
c)
6 & 12
d)
6 & 8
169.
In my fish tank, the ratio of red fish to blue fish is 3:5. There are 20 blue fish. How many red fish are there?
a)
18
b)
12
c)
4
d)
15
170.
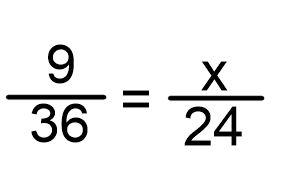
Solve for x
a)
x=6
b)
x =1/6
c)
x = 7
d)
x=9
171.
88 students for 4 classes
How many students per class?
a)
22 students per class
b)
22 classes per student
c)
25 students per class
d)
25 classes per student
172.
Jose swims 3 laps in a pool every 2 minutes. How long would it take him to swim 27 laps?
a)
8 minutes
b)
9 minutes
c)
16 minutes
d)
18 minutes
173.
You spend $40 on 5 pounds of concrete. What is the unit rate in dollars per pound?
a)
$8 per pound
b)
$5 per pound
c)
$35 per pound
d)
0.125 pounds per dollar
174.
Sarah wants to buy tomatoes, which is the best deal?
15 kg for $32.25
4 kg for $8.72
a)
15 kg for $32.25
b)
4 kg for $8.72
c)
Neither
175.
Identify the best deal.
27 ounces of nacho chips for $3.51
10 ounces of nacho chips for $1.30
a)
27 ounces of nacho chips for $3.51
b)
10 ounces of nacho chips for $1.30
c)
Neither
176.
Choose the best deal for buying oranges
$52.16 for 8 dozen
$33.77 for 5 dozen
a)
$52.16 for 8 dozen
b)
$33.77 for 5 dozen
c)
Neither
177.

Find 78% of 160.

a)

128.4

b)

124.8

c)

124

d)

128

178.

Find 12% of 325.

a)

3,900

b)

300

c)

900

d)

39

179.
Which ratio is equivalent to 5 to 4
a)
25 to 20
b)
10 to 12
c)
4 to 5
d)
15 to 8
180.
Which ratio is equivalent to 12:20
a)
20:12
b)
2:3
c)
3:5
d)
3:10
181.
What ratio is equivalent to  12:20
a)
20:12
b)
2:3
c)
3:5
d)
3:10
182.
True or false.
¾  =  ⅝
a)
True
b)
False
183.
True or false.
¾  =  ⅝
a)
True
b)
False
184.
Mrs. Shelly paid $3 for 6 muffins and Mrs. Kloske paid $9 for 18 muffins.  
a)
yes, equivalent
b)
no, not equivalent
185.
$15 for 5 pairs of socks; $25 for 10 pairs of socks. Are the ratios equivalent?
a)
yes, equivalent
b)
no, not equivalent
186.
 Shirley spelled 12 of her 15 spelling words correctly on the test.  What percent grade did Shirley get on the test?
a)
40%
b)
50%
c)
80%
d)
60%
187.
Eric earned 60 points on his last test. If there were 75 possible points, what was his percent grade?
a)
20%
b)
40%
c)
60%
d)
80%
188.
Find the AREA of this figure.
a)
160 square feet
b)
161 feet
c)
106
d)
1600 feet
189.
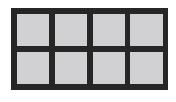
Find the area of the rectangle.
a)
8 square units
b)
9 square units
c)
10 square units
d)
12 square units
190.
What is the area of this figure?
a)
12 sq. cm
b)
32 sq. cm
c)
16 sq. cm
d)
28 sq. cm
191.

What is the area?

a)

27 m2

b)

54 m2

c)

54 m

d)

15 m2

192.

What is the area?

a)

90 m2

b)

45 m2

c)

19 m

d)

15 m2

193.

Check out the image of the Trapezoid. The base one b1=1.6m ,base two b2= 4m , height h=2m. Find the Area of the Trapezoid using the formula: A= 1/2 (b1 + b2) h

a)

A= 6.5m2

b)

A=5.6m2

c)

A=6,4m2

d)

A=

194.
Find the area of this triangle.
a)
240 ft2
b)
56 ft2
c)
66 ft2
d)
120 ft2
195.
a)
2 in2
b)
32 m2
c)
32 in
d)
32 in2
196.

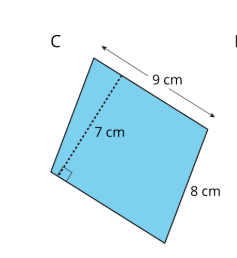
What is the area of the parallelogram?

a)

63 cm2

b)

72 cm2

c)

56 cm2

197.
Find the area of the parallelogram.
a)
12 units2
b)
10 units2
c)
13 units2
d)
6 units2
198.
What is the area?
a)
56 square cm
b)
28 square cm
c)
32 square cm
d)
19 square cm
199.
What is the area of the shape?
a)
35 units squared
b)
24 units squared
c)
not enough information
d)
22 units squared
200.
What is the area of this figure?
a)
7 units2
b)
15 units2
c)
7 1/2 units2
d)
15 1/2 units2
201.
What is the distance between(3, 5) and (6, 5)?
a)
9 units
b)
3 units
c)
-9 units
d)
-3 units
202.
5x + 3y + 5 + 4x + 3y + y + 8
a)
9x + 7y + 13
b)
6x + 2y + 2
c)
25x + 2y + 3
d)
x + 7y + 12
203.
Simplify the following expression:
3 + 5x + 8 - 2x
a)
-3x2 - 11
b)
3x2 + 11
c)
11 - 3x
d)
11 + 3x