Wayground logo

Free Printable Worksheets

Font size

S
M
L
XL
Worksheets

Making and Interpreting a Table

Total questions: 74

Worksheet time: 6hrs 10mins

Name
Class
Date
1.

How many members planted at least 3 seeds?

a)

19

b)

36

c)

55

d)

72

2.

How many people planted fewer than 5 seeds?

a)

13

b)

54

c)

67

d)

83

3.

How many medals did Sweden win in 1984?

a)

12

b)

19

c)

24

d)

32

4.

In 1980, how many more medals did Italy win than Australia?

a)

6

b)

9

c)

15

d)

24

5.
Branden wrote down his puppy's weight each month for three months. He made this table. How did the puppy's weight change from March through May? 
a)
The puppy gained 4 pounds in all.
b)
The puppy gained 7 pounds in all.
c)
The puppy gained 11 pounds in all.
d)
 The puppy gained 19 pounds in all.
6.
Free stickers are being given away at Carmela's school basketball game tonight. Carmela will choose one sticker from the bag without looking. What color of sticker is Carmela most likely to take from the bag?
a)
orange
b)
red
c)
blue
d)
yellow
7.

Based on this table which country seems the WORST, like you would NOT want to live there?

a)

Country A

b)

Country D

c)

Country E

d)

Country B

8.

What is the most popular flavor in class 7C?

a)

Vanilla

b)

Chocolate

c)

Strawberry

d)

Mint

9.

This is an example of ______________.

a)

pie chart

b)

bar graph

c)

diagram

10.

This is an example of ____________.

a)

line graph

b)

diagram

c)

table

11.

How many more people voted for Garza than Price and Turner combined?

a)

8

b)

26

c)

23

d)

33

12.

How many boys AND girls have shoes that are 20 centimeters long?

a)

8

b)

9

c)

17

d)

10

13.

How many total students were surveyed?

a)

64

b)

60

c)

24

d)

54

14.

How many boys were surveyed?

a)

20

b)

29

c)

30

d)

35

15.

Which animal was the most common pet?

a)

Rabbit

b)

Dog

c)

Cat

d)

Goldfish

16.

Which animal was the least common pet?

a)

Rabbit

b)

Dog

c)

Hamster

d)

Goldfish

17.

How many people had either a cat or a goldfish?

a)

17

b)

11

c)

6

d)

15

18.

How many more people had a dog than a rabbit?

a)

3

b)

8

c)

6

d)

4

19.

How many students liked cornflakes the best?

a)

3

b)

8

c)

4

d)

2

20.

How many students voted all together?

a)

12

b)

15

c)

17

d)

16

21.

What type of graph is this?

a)

line graph

b)

bar graph

c)

picture graph

d)

color graph

22.
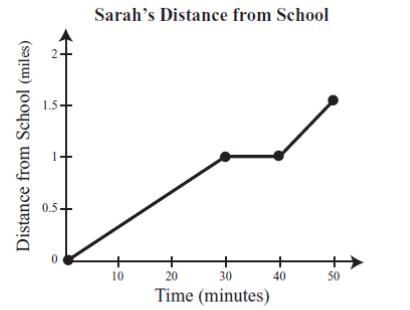
What is happening in the graph between 30 and 40 minutes?
a)
Sarah is accelerating
b)
Sarah is not moving
c)
Sarah is slowing down
d)
Sarah is travelling at a constant speed
23.

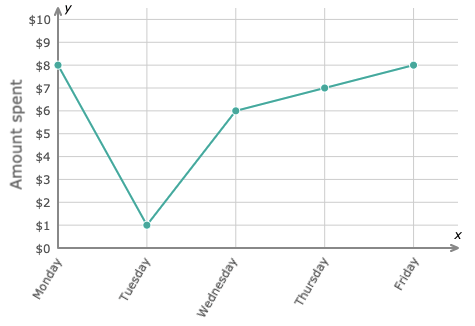
How much money was spent on Thursday?

a)

1

b)

6

c)

7

d)

8

24.

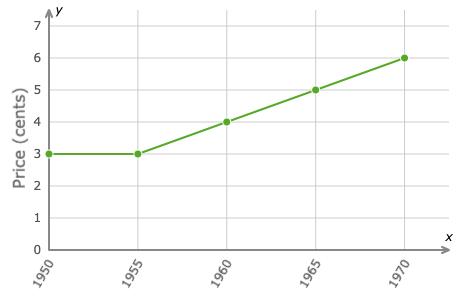
How much was a stamp in 1965?

a)

3 cents

b)

4 cents

c)

5 cents

d)

6 cents

25.

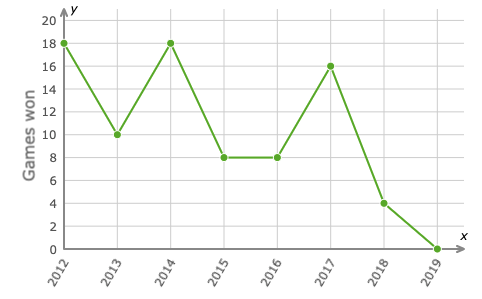
How many more games were won in 2014 than 2015?

a)

4

b)

8

c)

10

d)

12

26.

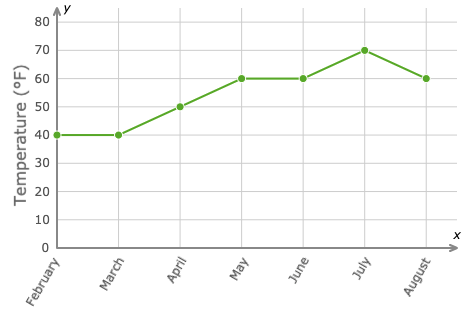
How much warmer was the temperature in April than March?

a)

10 degrees

b)

20 degrees

c)

30 degrees

d)

40 degrees

27.

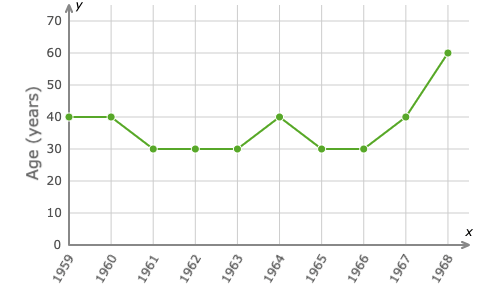
Between what two years did the average age increase by 20?

a)

1967-1968

b)

1960-1961

c)

1962-1963

d)

1966-1967

28.

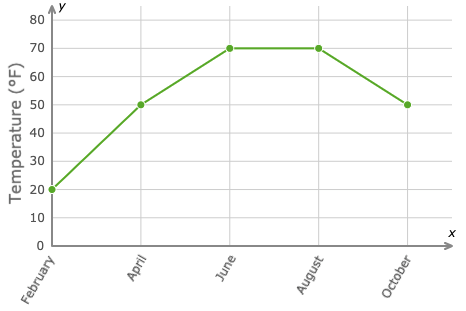
What month was the coldest?

a)

February

b)

April

c)

August

d)

October

29.
How many students spent over 40 minutes but under 60 minutes studying?
a)
22 Students
b)
30 Students
c)
8 Students
d)
5 Students
30.
How many more people studied for 0-30 minutes than people who studied for 121-150 minutes?
a)
3
b)
6
c)
5
d)
4
31.

How many people were surveyed to collect this data?

a)

18

b)

20

c)

22

d)

24

32.

How many baseball teams scored 0 runs per inning?

a)

4

b)

3

c)

2

d)

1

33.

How many students play soccer and baseball?

a)

90

b)

40

c)

50

d)

110

34.

How many strawberries does Ed have?

a)

2

b)

1

c)

4

d)

6

35.

A pictograph must always have a

a)

Marker

b)

Title

c)

Cup of coffee

d)

A key

36.
How many more people like the color purple than blue?
a)
1
b)
3
c)
6
d)
8
37.

Jack made this graph to show the number of movies that were rented from his store during four months. Which whole number shows how many more movies were rented in December than in September?

a)

20

b)

35

c)

45

d)

80

38.

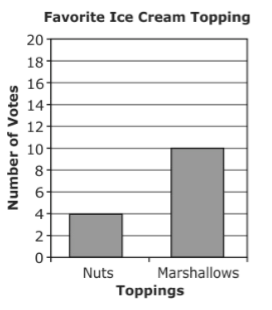
Students voted for their favorite ice cream topping. How many more students chose marshmallows than chose nuts?

a)

4

b)

6

c)

10

39.

Mary is recording her plant's growth in a journal. How many inches has the plant grown from week 1 to 7?

a)

22

b)

18

c)

14

40.
How many people like football and basketball?
a)
9
b)
4
c)
10
d)
2
41.
Did the temperature increase or decrease between day 1 and day 2?
a)
increase
b)
decrease
42.

Between which two years did the bear population remain constant or the same?

a)

2004 and 2005

b)

2001 and 2002

c)

2005 and 2006

d)

2000 and 2001

43.
Between which two days was the greatest decrease in push-ups?
a)
Friday and Saturday
b)
Tuesday and Wednesday
c)
Sunday and Monday
d)
Thursday and Friday
44.
When was the greatest amount of shoppers at the store?
a)
10am
b)
1pm
c)
6pm
d)
2pm
45.
Mr. Semo is making a histogram to show the scores on the last science test. He first lists the scores in a stem-and-leaf plot. How many units tall should the bar be for the interval 70-79?
a)
2
b)
5
c)
9
d)
11
46.
How many students have more than 1,000 songs on their MP3 player?
a)
5
b)
16
c)
10
d)
4
47.
How many cities have temperatures between 70 degrees and 99 degrees?
a)
44
b)
34
c)
26
d)
62
48.

Which interval has 400 employees?

a)

33-43

b)

0-10

c)

77-87

d)

66-76

49.

Which table represents the data in the graph?

a)
b)
c)
d)
50.
What is the total percent of a pie or circle graph?
a)
10%
b)
50%
c)
100%
d)
1000%
51.
According to this circle graph, what is the least popular flavor of Jolly Rancher?
a)
Blue Rasberry
b)
Watermelon
c)
Grape
d)
Apple
52.
There are 200 vegetable plants in a garden.  How many of the vegetable plants are green beans?
a)
16
b)
24
c)
28
d)
32
53.

What desert had the least amount of votes?

a)

fruit

b)

yogurt

c)

cake

d)

icecream

54.

Which activity do 2nd graders like to do after school the most?

a)

ride bikes

b)

sports

c)

read

d)

watch tv

55.

What is name of the chart pictured below?

a)

Line Graph

b)

Pie Chart

c)

Bar Graph

d)

Line Plot

56.

Which of the lists below shows the minerals in order from softest to hardest?

a)

Diamond, Quartz. Chalk, Copper

b)

Chalk, Copper, Quartz, Diamond

c)

Chalk, Quartz, Copper, Diamond

d)

Chalk, Diamond, Copper, Quartz

57.

Look at the graph. How many runs did Doug score?

a)

8

b)

11

c)

12

d)

15

58.
Which color is the most favorite?
a)
red
b)
green
c)
yellow
d)
blue
59.
How many people added hot sauce to their food on Monday?
a)
40
b)
20
c)
70
d)
80
60.
What is the title of the graph?
a)
Metro Bicycle Shop Weekly Sales
b)
Bicycles Sold
c)
Types of Bicycles
61.

Snakes depend of frogs as a food source. If the pH is 5.5, what is likely to happen to the size of the snake population? (Think back to the question you just answered.)

a)

The snake population will decrease because there will not be as many frogs, because the frogs eat mayflies, and mayflies can't survive in a 5.5 pH.

b)

The snake population will increase because there will be so many frogs for them to eat.

c)

The snake population will stay the same as usual because there will be the same amount of frogs to eat.

d)

The snake population will decrease because frogs will not survive in a 5.5 pH.

62.
Where does the majority of electrical energy come from in Oregon?
a)
Hydroelectric
b)
Natural Gas
c)
Wood
d)
Wind
63.
Which pet is the least favorite?
a)
cat
b)
dog
c)
hamster
64.
Sean enjoys studying the stars. He used a photometry tool to calculate several stars' apparent magnitudes (how bright a star looks in the sky). He then researched the stars' distances from Earth. He recorded his results in the table below.
What conclusions can Sean draw from his chart?
a)
A star's apparent magnitude increases as its distance from Earth increases.
b)
A star's apparent magnitude decreases as its distance from Earth increases.
c)
A star's apparent magnitude decreases if it is very close to another star.
d)
A star's apparent magnitude is not directly related to its distance from Earth.
65.
What label is along the y-axis in this graph?
a)
Number of teams
b)
Smalltown teams
c)
Lines
d)
frequency table
66.
What was the longest worm found?
a)
8.5 cm
b)
8.75 cm
c)
9.0 cm
d)
9.5 cm
67.

What does each x represent?

a)

hours of exercise

b)

minutes of exercise

c)

a person

d)

days of exercise

68.

How many people exercised 1/4 hour (15 minutes)?

a)

3

b)

6

c)

4

d)

5

e)

2

69.

How many people did not exercise?

a)

3

b)

6

c)

4

d)

5

e)

2

70.

How many people exercised for 1/2 hour (30 minutes) or more?

a)

3

b)

6

c)

4

d)

11

71.

How many more people exercised 3/4 hour (45 minutes) than 1/2 hour (30 minutes)?

a)

4

b)

5

c)

1

d)

2

72.

How many people exercised less than 1/2 hour (30 minutes)?

a)

9

b)

4

c)

6

d)

13

73.

How much time did most people exercise? (What is the mode?)

a)

0 hours

b)

1/4 hour

c)

1/2 hour

d)

3/4 hour

e)

1 hour

74.

A line (dot) plot is a type of frequency chart.

a)

True

b)

False