
NEW
Font size
 Worksheets
Demand, Supply & Market Equilibrium
Total questions: 10
Worksheet time: 5mins
For the law of demand, as price rises, what happens to quantity demanded?
it goes up
it goes down
it stays the same
it is not effected
Equilibrium in a market means which of the following?
the point at which quantity supplied and quantity demanded are the same
the point at which unsold goods begin to pile up
the point at which suppliers begin to reduce prices
When quantity supplied exceeds quantity demanded at a certain price.
shortage
fad
search costs
surplus
Legal maximum that can be charged for a good.
price ceiling
excess demand
equilibrium
disequilibrium
Why does the government place price ceilings on some "essential" goods?
to prevent inflation during to reduce supply for these goods
to keep business people from making large profits
to keep the goods from becoming too expensive
to reduce demand for these goods
Last year, 50,000 people lived in the city of Fairfax.
But since then, 8,000 people have moved away. What probably happened to the overall supply of houses for sale in Fairfax?
The supply probably went up
The supply probably went down
Mr Coyote goes to the ticket booth to buy tickets for a Spurs game. Mr. Coyote is told that the game is sold out and no tickets are available. Which best explains why there are no basketball tickets available?
The arena forgot to print enough tickets.
The supply of tickets was greater than the demand.
The arena charged too much money for each ticket.
The demand for tickets was greater than the supply.
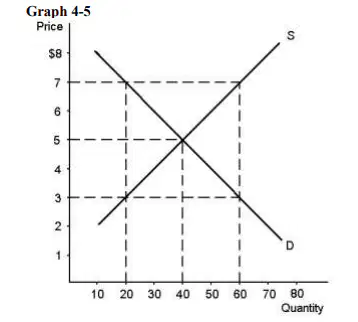
Refer to Graph 4-5. According to the graph, what are the equilibrium price and quantity ?
$7, 20.
$7, 60.
$5, 40
$3, 60.

Refer to Table 4-2. In the table shown, what would be the result if the price were $8?
a surplus of 30 units would exist and price would tend to fall.
a surplus of 60 units would exist and price would tend to rise.
a surplus of 60 units would exist and price would tend to fall.
a shortage of 30 units would exist and price would tend to rise.
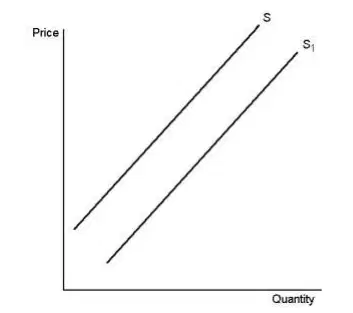
Refer to Graph 4-4. On the graph, what could most likely cause the movement from S to S1?
A decrease in the price of the good.
An increase in income.
An improvement in technology.
An increase in input prices.

