
 Worksheets
MTM6.10 - Data and Statistics (6th CCSS)
Total questions: 10
Worksheet time: 5mins
Name
Class
Date
1.

1. The number of points in the first five games of the football season are listed below. What is the mean number of points scored?
a)
A. 33
b)
B. 31.6
c)
C. 26
d)
D. 19
2.
2. Which of the following is likely to have the greatest variability?
a)
F. The cost of a piece of candy from a vending machine
b)
G. The height of all the students at West Middle School
c)
H. The age of all the students in the sixth grade
d)
J. The number of days in a month
3.
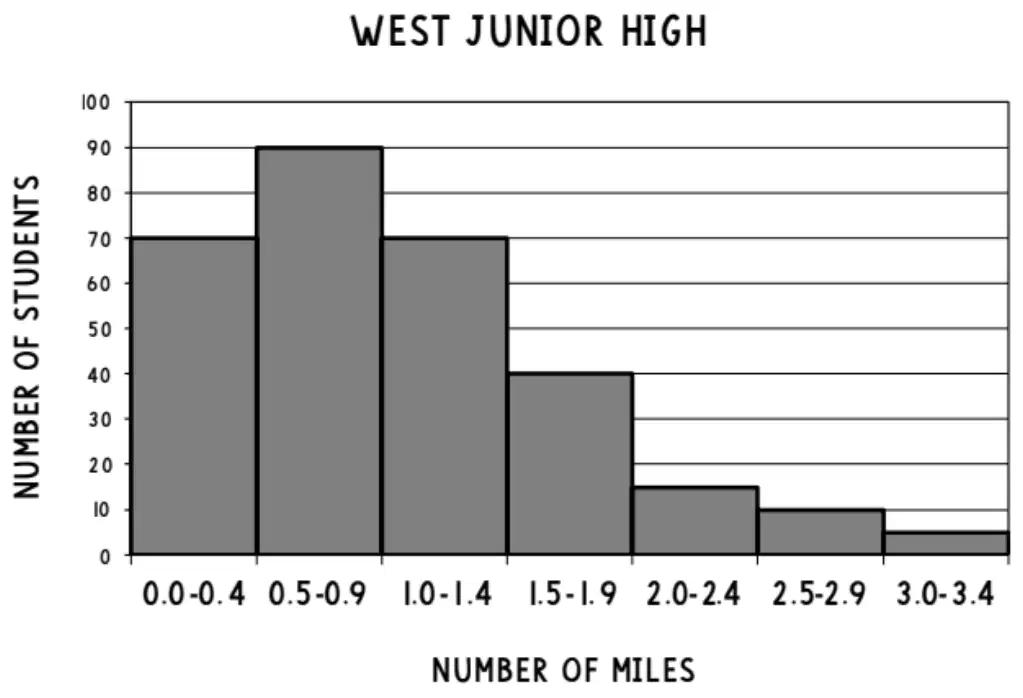
3. A survey of sixth-grade students measured how many miles they traveled to school. The distance was complied and displayed in a histogram. Which of the following statements best describes the data?
a)
A. The data is skewed left, as most students live close to the school.
b)
B. The data is symmetrical, as most students live far from the school.
c)
C. The data is skewed right, as most students live close to the school.
d)
D. The data is symmetrical, as most students live close to the school.
4.
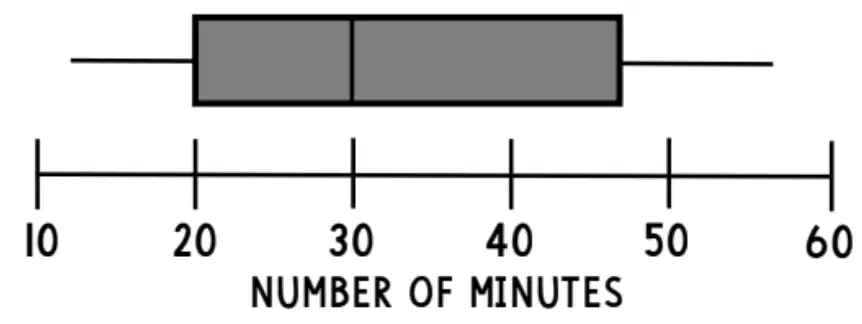
4. Students record the number of minutes they read each day. The box plot shows the summary of the results. Which statement best describes the data?
a)
F. A quarter of the students read for 20-30 minutes.
b)
G. The least number of students read less than 30 minutes.
c)
H. Over half the students read for 40 minutes or more.
d)
J. The average number of minutes read was 47.
5.
5. Which of the following does not represent a statistical question?
a)
A. How tall are the students in my class?
b)
B. How many hours per week do you practice sports?
c)
C. How many laps can the students on the track team run?
d)
D. How much do the students on the football team weigh?
6.
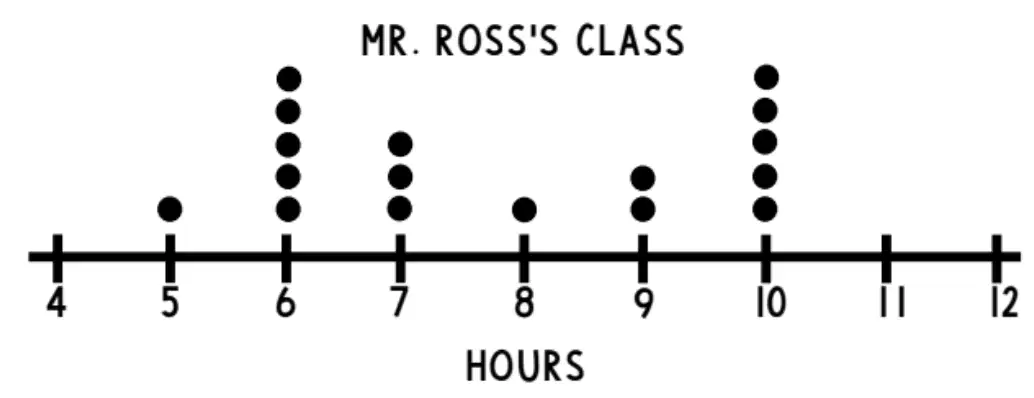
6. The dot plot shows the number of hours the students in Mr. Ross’s class slept last night. Which of the following statements is not correct?
a)
F. There are a total of 17 students in Mr. Ross’s class.
b)
G. Exactly 9 students slept for less than 8 hours.
c)
H. More than half of the students slept for at least 7 hours.
d)
J. All of the students in Mr. Ross’s class need more sleep.
7.
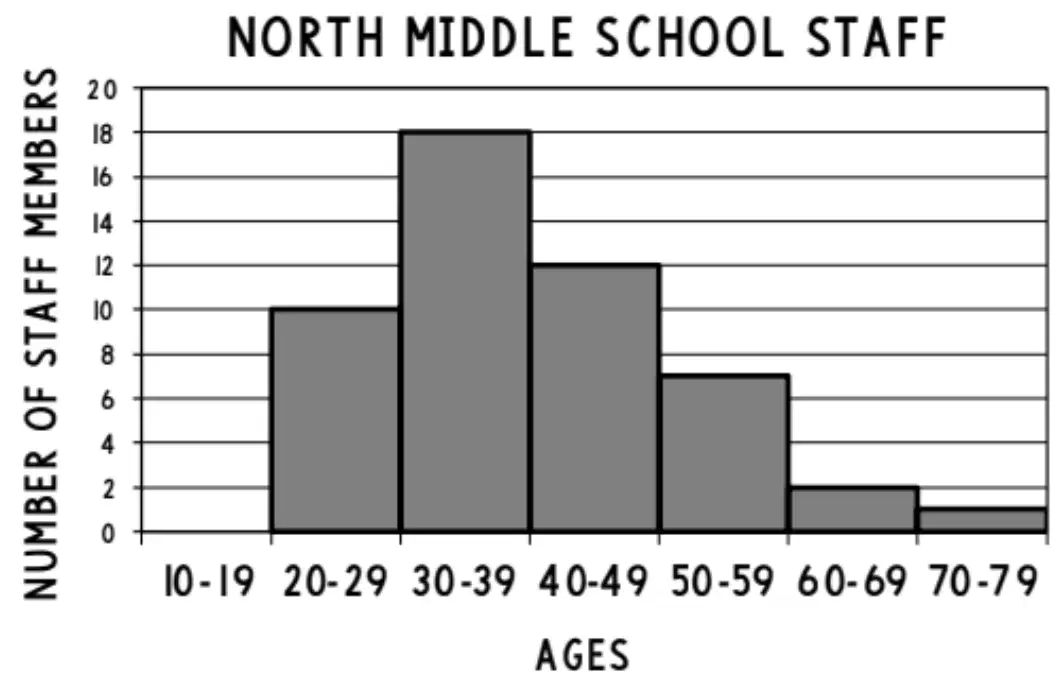
7. A survey of North Middle School staff included staff members ages. The ages were complied and displayed in a histogram. Which of the following statements best describes the data?
a)
A. There were 12 staff members between the ages of 20-29.
b)
B. The number of staff members under the age of 40 is equal to the number of staff members 40 and older.
c)
C. Sixty staff members were included in the survey.
d)
D. A total of 10 staff members are 50 years or older.
8.

8. The number of free throws made by the members of a basketball team are shown. Which best represents the data?
a)
F.
b)
G.
c)
H.
d)
J.
9.
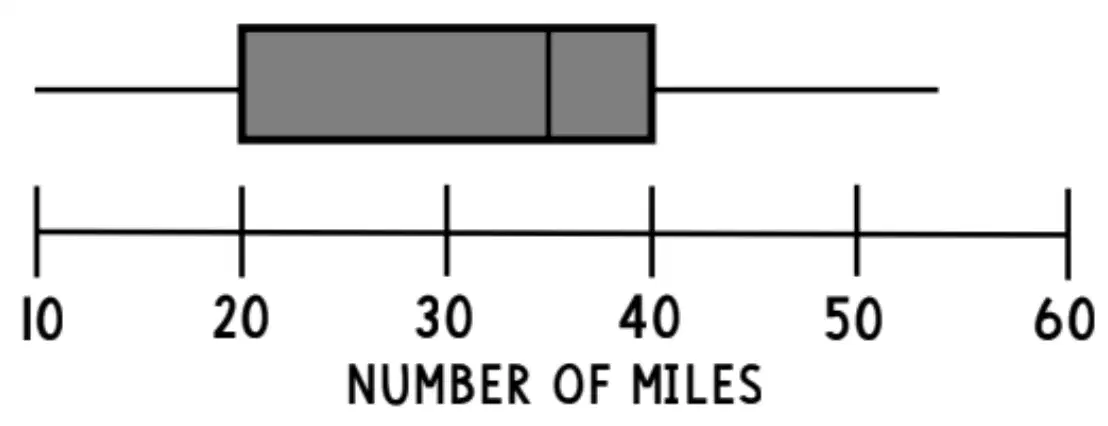
9. Employees were asked how many miles they traveled to work each day. The data is shown below in the box plot. Which of the statements best supports the data?
a)
A. Median = 30, IQR = 20
b)
B. Median = 35, IQR = 20
c)
C. Median = 40, IQR = 45
d)
D. Median = 35, IQR = 45
10.
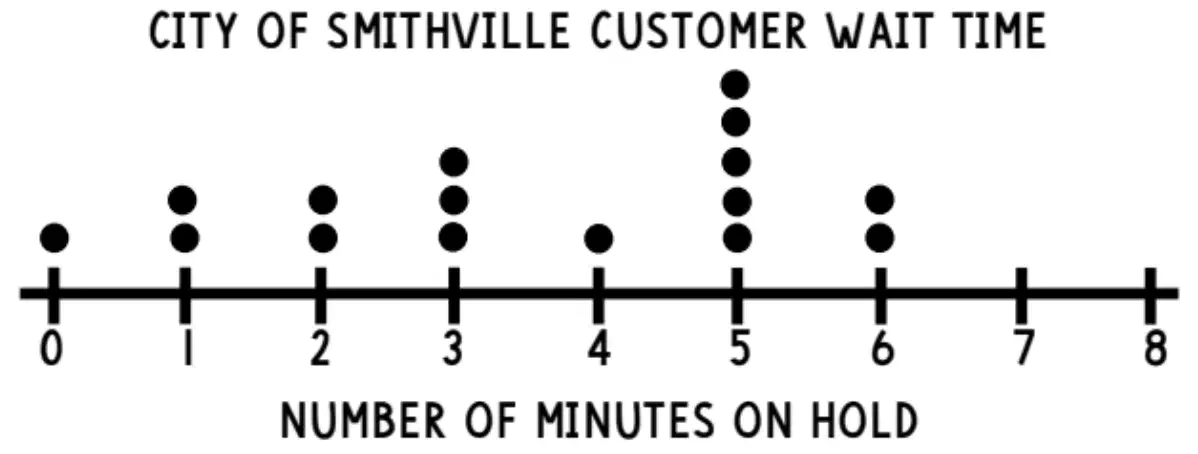
10. The City of Smithville recorded how many minutes a customer waits to talk to a representative on the phone. What is the mean number of minutes a customer waits?
a)
F. 3.5
b)
G. 4
c)
H. 4.5
d)
J. 5
100 %

