
 Worksheets
Graphing SHORT
Total questions: 114
Worksheet time: 6hrs 35mins



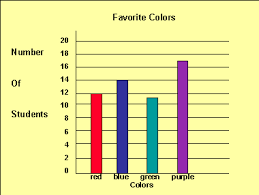
The graph shows the number of colored beads used to make a necklace. How many purple and green beads were used in all?
23
20
18
15








How many friends are on the swings and monkey bars combined?
10
12
18
20

How many more people like apples than peaches?
2
6
4
8

Which fruit has 16 votes?
apple
banana
peach
orange








How many stamps does Andy have in all?
8
24
21
28

How many more stamps does John have than Kristin?
2
3
6
9

Who has 15 stamps?
Andy
John
Susan
Leon

Which games are more popular than tennis?
soccer
softball
basketball
baseball

How many children are playing basketball?
6
15
18
21

How many children are playing baseball and softball?
7
15
6
21

How many children would need to get on the swings to make an equal number of children on the swings and slide?
4
3
5
2

How many fewer friends are on the merry-go-round than the seesaw?
2
3
4
6
How many friends are on the swings and monkey bars combined?
10
12
18
20
How many more people like apples than peaches?
2
6
4
8

How many people like oranges and bananas altogether?
24
28
7
20
Which fruit has 16 votes?
apple
banana
peach
orange

How many more chickens would the farm need to equal the number of ducks that it has?
1
2
3
4

What is the total number of chickens, sheep, and horses?
18
15
17
16

Which animals have a lower number than the chicken?
cow
duck
sheep
horse

Most of the bows in the box were
blue
red
yellow
green
orange

How many more bows are orange than yellow?
6
9
15
3

If I only choose blue and green bows, how many bows will I have?
21
7
18
24

How many children have lost three or more teeth?
5
9
12
15

How many children have lost an odd number of teeth?
3
6
9
18

Which item costs the least amount of money?
Button Down Shirt
Socks
Jeans
T-shirt
Tie

Select the statements below that are true about the graph
Swimming was the most popular summer sport.
Nine more people like surfing than swimming.
Water Skiing, Boating, and Diving were equally popular.

On how many days was the temperature less than 30°F?
1
2
3
4
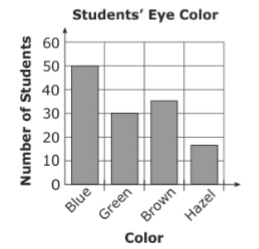
Miss Lee's science class collected data on the color of 3rd grade student's eyes. The students created a bar graph with this information. How many more students had blue eyes than green eyes?
80
50
30
20

The graph shows the number of cars sold from January to April. How many more cars were sold in March than in January?
2,000
5,000
7,000
8,000
The graph shows the number of colored beads used to make a necklace. How many purple and green beads were used in all?
23
20
18
15


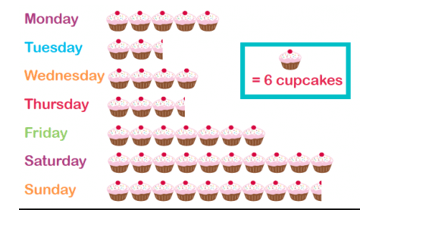
How many people ate cupcakes on Tuesday and Wednesday?
1
24
39
40
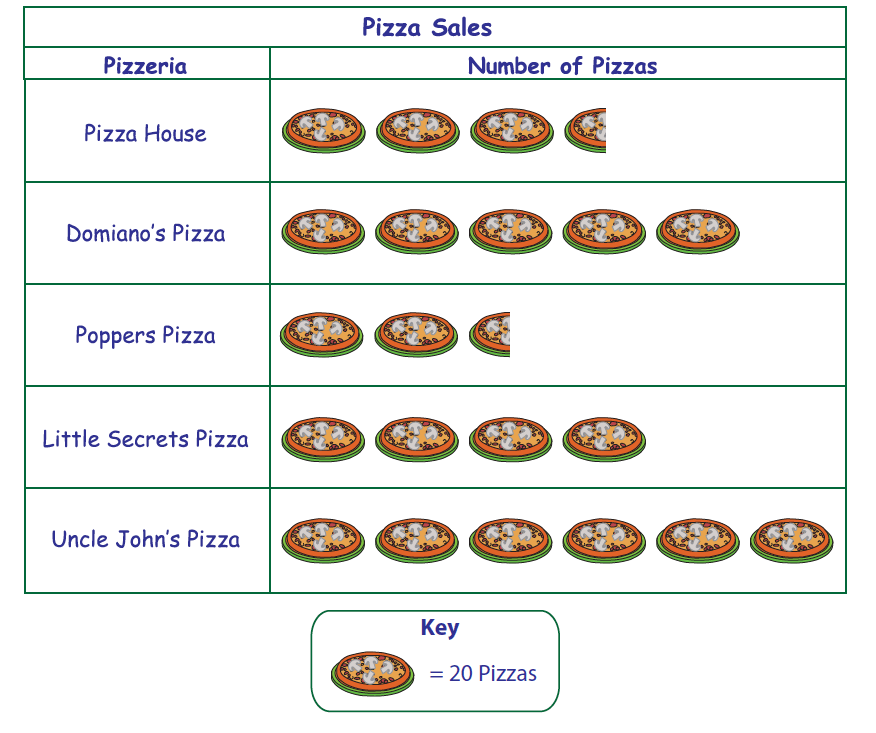
How many pizzas were sold by Peppers Pizza?
50
3
30
2 and a half
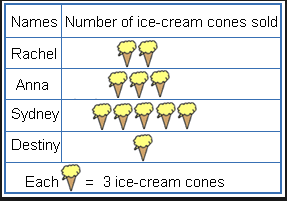
How many cones were sold in all?
16
21
11
33
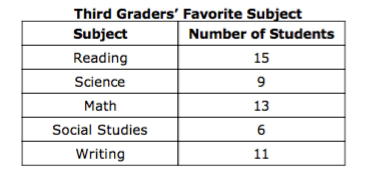
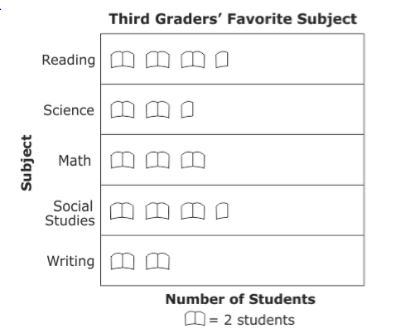
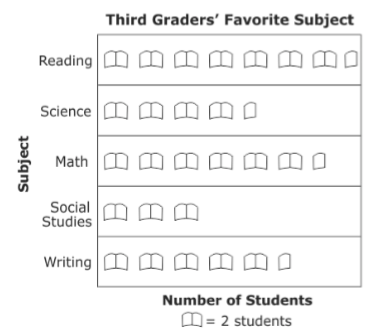
Students in 3rd grade collected data on their favorite subject and recorded it on the table shown. Which graph shows this information?
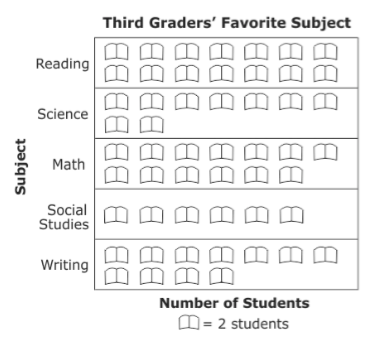


What was the most amount of candy bars a student had?
0
6
1
5


What type of music did students choose the least amount of times?
hip hop
classical
rock
jazz
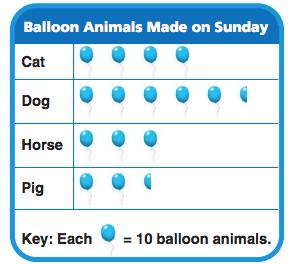
How many balloon animals did Landon make in all on Sunday?
15
140
150
160


How many horses does Nate have on his farm?
4
3
2
5


