wayground logo

Free Printable Worksheets

Font size

S
M
L
XL
Worksheets

Tri 3 Exam Review

Total questions: 122

Worksheet time: 6hrs 29mins

Name
Class
Date
1.

The point (-2, -3) is in which quadrant?

a)

1

b)

2

c)

3

d)

4

2.

The point (8, 15) is in which quadrant?

a)

1

b)

2

c)

3

d)

4

3.

The point (-3, 6) is located in which quadrant?

a)

1

b)

2

c)

3

d)

4

4.

Which quadrant is located in the lower right corner of the graph?

a)

1

b)

2

c)

3

d)

4

5.

The point (0, 5) is located where on a graph?

a)

Quadrant 1

b)

On the y-axis

c)

On the x -axis

d)

Quadrant 3

6.

The x axis stretches

a)

up and down

b)

left to right

7.

The y axis stretches

a)

up and down

b)

left to right

8.
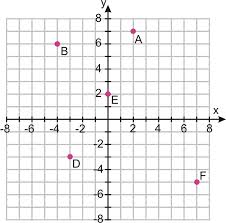
Where is point E located?
a)
( 2, 0 )
b)
( 2 , 2 )
c)
( 0 , 2 )
d)
( 0 , 0 )
9.
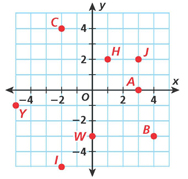
Give the coordinates for POINT H.
a)
(-1, 2)
b)
(1, -2)
c)
(-1, -2)
d)
(1 , 2)
10.
Give the coordinates for POINT I.
a)
(-2, 5)
b)
(-2, -5)
c)
(2, 5)
d)
(2, -5)
11.
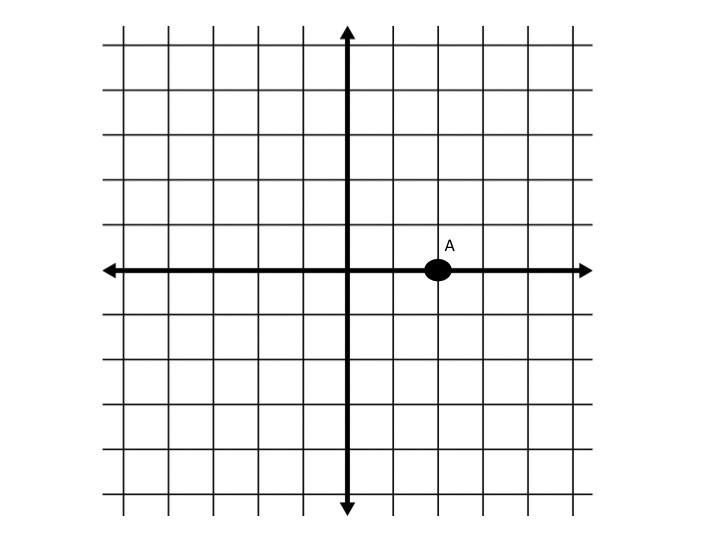
What is the ordered pair for point A?
a)
( 2, 0)
b)
( 0 , 2)
c)
(0, -2)
d)
(-2,0)
12.
The coordinates for the origin in the coordinate plane are________?
a)
(1,1)
b)
(0,0)
c)
(0,1)
d)
(1,0)
13.
a)
F
b)
G
c)
H
d)
J
14.
a)
A
b)
B
c)
C
d)
D
15.
a)
F
b)
G
c)
H
d)
J
16.

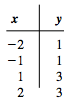
Does the table represent a function?

a)

Yes

b)

No

17.
.
a)
Function
b)
Not a Function
18.
Is the relation a function?{(1,5),(1,7),(3,9),(4,11)}
a)
Yes
b)
No
19.
Which set of values is a function?
a)
(9,5) (10,5) (9,-5) (10,-5)
b)
(3,4) (4,-3) (7,4) (3, 8)
c)
(6,-5) (7, -3) (8, -1) (9, 1)
d)
(2, -2) (5, 9) (5, -7) (1, 4)
20.

Is this table a function?

a)

NO

b)

YES

21.
All of the y values or outputs are called what?
a)
Domain
b)
Range
c)
Relation
d)
Function
22.
All of the x values or inputs are called what?
a)
Domain
b)
Range
c)
Relation
d)
Function
23.
a)
Function
b)
Not a Function
24.
Is this a function? Explain.
a)
Yes; it passes the horizontal line test.
b)
No; it is not a straight line.
c)
Yes; it passes the vertical line test.
d)
No; there is a line connecting the dots.
25.
a)
Function
b)
Not a Function
26.

What is the value of x in a y-intercept?

a)

1

b)

0

c)

the same as the y value

d)

-1

27.

What is the value of y in an x-intercept?

a)

the same as the y value

b)

1

c)

0

d)

-1

28.
What is the y-intercept of the line graphed below?
a)
-3
b)
4
c)
3
d)
4/3
29.

What is the y-intercept of the line shown?

a)

3

b)

-3

c)

2

d)

-2

e)

0

30.

What is the x-intercept of the line shown?

a)

3

b)

-3

c)

2

d)

-2

e)

0

31.
Find the slope of the line.
a)
1/2
b)
-1/2
c)
2/1
d)
-2/1
32.
Find the slope of the line.
a)
-5/4
b)
5/4
c)
-4/5
d)
4/5
33.

State the slope of the red line.

a)

Positive

b)

Negative

c)

Undefined

d)

Zero

34.

State the slope of the red line.

a)

Positive

b)

Negative

c)

Undefined

d)

Zero

35.
What is the slope in the picture?
a)
Positive
b)
Negative
c)
Zero
d)
Undefined
36.

Find the slope of the line.

a)

Undefined

b)

Zero

c)

1

d)

-1

37.
How do you write an ordered pair?
a)
(X,X)
b)
(Y,X)
c)
(X,Y)
d)
(Y,Y)
38.
For the function {(0,1), (1,-3), (2,-4), (-4,1)}, write the domain and range.
a)
D: {1, -3, -4,}
R: {0, 1, 2, -4}
b)
D:{0, 1, 2, -4}
R:{1, -3, -4}
c)
D:{0, 1, 2, 3, 4}
R:{1, -3, -4}
d)
D:{0, 1, 2, 3}
R:{0, 1, 2, 3, 4}
39.
y = x - 6
What is the missing number?
a)
12
b)
10
c)
14
d)
13
40.
To find the slope of a line, you find the rise over the run.
a)
True
b)
False
41.

Use the distributive property to simplify:

2(c - 8)

a)
2c - 16
b)
2c + 16
c)
2c - 8
d)
c - 16
42.

Use the distributive property to simplify:

3(2c - 5)

a)
6c - 15
b)
6c + 15
c)
6c + 15
d)
-6c - 15
43.
Fill in the blank:
2(x + 7) = 2x + __
a)
7
b)
14
c)
7x
d)
14x
44.

Evaluate (Solve):


f-22=36

a)

f = 62

b)

f = 14

c)

f = 58

d)

f = 12

45.

Solve for x.


x + 12 = 20

a)

x = 8

b)

x = -32

c)

x = 32

d)

x = -8

46.

Solve for x:

x + 4 = -3

a)
-1
b)
4
c)
-7
d)
8
47.

Solve for x:

6 x = -30

a)
2
b)
7
c)
-5
d)
5
48.

Solve for m:

m/5 = -3

a)
-5
b)
2
c)
-15
d)
-3
49.
Solve for x:
-30 - 5x = 120
a)
x = 18
b)
x = -18
c)
x = 30
d)
x = -30
50.

Solve for x.

2(x + 15) = -6

a)

x = -10.5

b)

x = -18

c)

x = 18

d)

x = 10.5

51.

Solve for r:

-9r + 12 = -24

a)
12
b)
3
c)
4
d)
2
52.

Solve for a:

9+2a=34a9+2a=-3-4a  

a)

a = -2

b)

a = 2

c)

a = 5

d)

a = -1

53.

Solve for b:

2b+4=7+b2b+4=7+b  

a)

b = 1

b)

b = -3

c)

b = -1

d)

b = 3

54.

Solve for j:

10j+9=4j910j+9=4j-9  

a)

j = 0

b)

j = 3

c)

j = -3

d)

j = -18

55.

Match the graph with its inequality.

a)

a > 11

b)

a < 11

c)

a ≥ 11

d)

a ≤ 11

56.
Match the graph with its inequality.
a)
b > –2
b)
b < –2
c)
b ≥ –2
d)
b ≤ –2
57.
Match the graph with its inequality.
a)
c > 9
b)
c < 9
c)
c ≥ 9
d)
c ≤ 9
58.

Which graph represents the following inequality:

6 > x

a)

A

b)
B
c)
C
d)
D
59.
When graphing an inequality, you use an open dot when you use which symbol?
a)
<, >
b)
≤, ≥ 
c)
≤, <
d)
≥, >
60.
When you graph an inequality, you used a closed dot when you use which symbols?
a)
≤, ≥ 
b)
<, >
c)
≤, <
d)
≥, >
61.

Solve for s:

s - 10 ≤ 1

a)
s ≤ 11
b)
s ≤ 9
c)
s ≥ 11
d)
s ≥ 9
62.

Solve for x:

10 ≥ x - 3

a)
x ≤ 13
b)
x ≥ 13
c)
x ≤ 7
d)
x ≥ 7
63.

Solve for w:

w∕-2 ≥ 4

a)
w ≤ -2
b)
w ≥ -2
c)
w ≤ -8
d)
w ≥ -8
64.

Solve for t:

-13t > 26

a)
t > -2
b)
t > 2
c)
t < 2
d)
t < -2
65.

Solve for n:

-3 ≥ (n/2)

a)
n ≤ -6
b)
n ≤ 6
c)
n ≥ 6
d)
n ≥ -6
66.
At Dominique's Donuts the number of donut holes in a bag can vary. Help Dominique find the mode.
12,10,10,10,13,12,11,13,10
a)
13
b)
12
c)
11
d)
10
67.
Ervin bowled 7 games last weekend. His scores are: 155, 165, 138, 172, 127, 193, 142. What is the range of Ervin's scores?
a)
193
b)
127
c)
60
d)
66
68.
What is the mode?
a)
# happening the most
b)
the average
c)
biggest - smallest
d)
the middle #
69.
Find the mean of these numbers:
5,11,2,12,4,2
a)
4.1
b)
6
c)
4.5
d)
4
70.
Find the median of these numbers:
4,2,7,4,3
a)
2
b)
5
c)
7
d)
4
71.
Find the median, mode and range: 
3, 5, 7, 9, 11, 8, 3
a)
median:7  mode:3  range:7
b)
median:6  mode:3  range:7
c)
median:7  mode:3  range:8
72.
To find the mean of a set of numbers, add up all the items and divide by...
a)
2
b)
The minimum
c)
The maximum
d)
The number of items
73.
In order to find the median, the data must be sorted from least to greatest first.
a)
True
b)
False
74.
What is the range?
a)
average
b)
biggest-smallest
c)
the middle #
d)
# happening the most
75.
What is the mode?
a)
# happening the most
b)
the average
c)
biggest - smallest
d)
the middle #
76.
What is the range?
a)
average
b)
biggest-smallest
c)
the middle #
d)
# happening the most
77.
In order to find the median, the data must be sorted from least to greatest first.
a)
True
b)
False
78.
To find the mean of a set of numbers, add up all the items and divide by...
a)
2
b)
The minimum
c)
The maximum
d)
The number of items
79.
The scores awarded to 25 students for an assignment were as follows:
4  7  5  9  8  6  7  7  8  5  6  9  8    5  8  7  4  7  3  6  8  9  7  6  9
What is  the mode?
a)
6
b)
7
c)
8
d)
9
80.
Find the mean of these numbers:
2, 57, 38, 42, 6
a)
29
b)
38
c)
50
d)
145
81.

Find the median.

12, 5, 10, 18, 25, 5

a)

9

b)

11

c)

12

d)

18

82.
 You must find the 5 number summary in order to make a box and whisker plot. 
a)
True
b)
False
83.
What is the minimum value?
a)
64
b)
58
c)
66
d)
60
84.
What is the maximum value?
a)
58
b)
66
c)
64
d)
60
85.
What percent of the data is between 25 and 30 on the number line?
a)
25%
b)
`50%
c)
75%
d)
100%
86.
11. What percentage of the data is between 90 and 140?
a)
25 %
b)
50%
c)
75%
d)
100%
87.
What value is the lower quartile?
a)
66
b)
58
c)
60
d)
64
88.
What data value is the upper quartile?
a)
64
b)
62
c)
66
d)
58
89.
What is the median?
a)
62
b)
58
c)
66
d)
60
90.
What is the interquartile range (IQR)?
a)
4
b)
64
c)
60
d)
8
91.
Which box and whisker plot has the highest median?
a)
Top plot
b)
Bottom plot
92.
What is the median of the data?
a)
200
b)
100
c)
90
d)
140
93.
1, 2, 3, 4, 7, 7, 7
The mode is 
a)
7
b)
4
c)
6
d)
3
94.

Find the range.

12, 5, 10, 18, 25, 5

a)

9

b)

5

c)

30

d)

20

95.

What is the range of the data shown in the stem and leaf plot?

a)

40

b)

56

c)

136

d)

96

96.
How many scores are listed in this Stem and Leaf Plot?
a)
3
b)
6
c)
9
d)
18
97.
In how many games did the team score more than 20 points?
a)
8
b)
7
c)
10
d)
9
98.
What is the mode of the scores?
a)
24
b)
14
c)
34
d)
30
99.

What is the median of the scores?

a)

21

b)

16

c)

17

d)

19

100.

How many cities have temperatures between 70 degrees and 99 degrees?

a)

44

b)

34

c)

26

d)

62

101.
How many students have more than 1,000 songs on their MP3 player?
a)
5
b)
16
c)
10
d)
4
102.
Elliot says almost everyone arrived at the party after 10:00 P.M., but Nancy thinks most people came earlier. When did a majority of the people arrive? 
a)
7:00-7:59 P.M.
b)
8:00–8:59 P.M.
c)
9:00–9:59 P.M.
d)
10:00–10:59 P.M. 
103.

What was the average score in all football games played?

a)

18

b)

16.4

c)

18.6

d)

17.6

104.

The histogram shows the birth weights of 100 new born babies. What percent of babies weighed between 6 and 7 pounds?

a)

15%

b)

45%

c)

30%

d)

25

105.
How many outfits are possible with 5 pairs of jeans, 8 t-shirts, and 2 pairs of shoes?
a)
15
b)
40
c)
80
d)
10
106.
At Papa John's you are deciding on what you want for dinner. The pizza offers 8 different meats, 4 different cheeses, 3 different crust types and 2 different sauces. How many different pizzas do you have to choose from?
a)
32
b)
192
c)
40,320
d)
51,200
107.
On a 6-sided die, which is more likely?
a)
Rolling an odd number
b)
Rolling an even number
c)
They are both equally likely.
108.
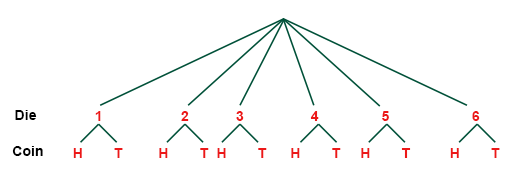
This tree diagram shows the outcomes of rolling a die and flipping a coin. 
How many total outcomes are there?  
a)
6
b)
12
c)
24
d)
36
109.

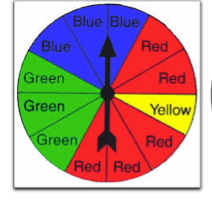
What is the probability of spinning yellow?

a)

1/11

b)

1/12

c)

1/4

d)

3/4

110.

If you choose from the following M & M colors, what is the probability that you choose blue? **Remember to simplify**

5 green

6 yellow

8 blue

7 brown

a)

8/18

b)

4/13

c)

8/25

d)

1/3

111.

Kyleigh saw 10 blue, 8 red, and 42 white cars drive by her house in 1 hour. What is the experimental probability that the next car the drives by her house will not be a white car?

a)

.5

b)

.6

c)

.3

d)

.7

112.

A 7th grade class rolls a number cube 50 times. The number cube has sides labeled 1 through 6. The table shows the results. Find the experimental probability for​ rolling a number greater than 4​.

a)

60%

b)

20%

c)

40%

d)

80%

113.

What sampling method is being described?


An agent assigns each car in a dealership a number and then use a random-number table to select the cars to be inspected.

a)

systematic

b)

simple random sample

c)

convenience

d)

Self - selected (volunteer)

114.

What sampling method is being described?


Political web pages often allow readers to rate (if they want to) whether they strongly agree, agree, disagree, or strongly disagree with the President's decision on any given situation.

a)

Voluntary Response

b)

Convenience Sampling

c)

Simple Random Sampling

d)

Systematic Random Sampling

115.

What sampling method is being described?


Marianne wanted to know students' opinion on the new schedule at school. She survey's the first 30 students who come into her class.

a)

Convenience Sampling

b)

Systematic Random Sampling

c)

Simple Random Sampling

d)

Voluntary response

116.

Darrien surveys the actors theater class. He concludes that 8 out of 15 actors have previous acting experience. How many actors would you expect to have experience out of 30?

a)

8 actors

b)

16%

c)

8%

d)

16 actors

117.

A recent survey of seventh graders from across the state shows 4 out of 10 like to play paper football. How many students said they like to play paper football out of 800?

a)

40 students

b)

200 students

c)

320 students

d)

8,000 students

118.

a)

1/2

b)

1/8

c)

1/3

d)

1/12

119.
Lucy has the spinner pictured and spins it twice in a row. What is the probability that she lands on blue first and then on green?
a)
1 / 16
b)
1 ⁄ 6
c)
1 ⁄ 8
d)
3 ⁄ 4
120.

Two marbles are randomly drawn from a bag containing 3 purple, 1 blue, and 1 yellow marble. Find the probability of drawing a blue marble, not replacing it, and then drawing a second marble that is purple.

a)

19/20

b)

3/4

c)

3/20

d)

3/25

121.
If you draw one card from a standard deck, what is the probability of drawing a spade or a red card?
a)
13/52
b)
26/52
c)
39/52
d)
Not possible
122.

If you roll one standard die, what is the probability of getting an odd number or a 4?

a)

2/3

b)

1/3

c)

1/2

d)

1/6