
Font size
 Worksheets
AP Stats Chapter 1 Voc and Concepts
Total questions: 15
Worksheet time: 13mins
Statistics is
the science and art of collecting, analyzing, and drawing conclusions from data
are objects described by a set of data. Individuals may be people, but they
may also be animals or things.
is any characteristic of an individual. A variable can take different values for
different individuals.
in any graph of data is an individual observation that falls outside the overall pattern of the graph.
Arrange all observation in order of size, from smallest to largest.
Individuals are
objects described by a set of data. Individuals may be people, but they
may also be animals or things.
is any characteristic of an individual. A variable can take different values for
different individuals.
places an individual into one of several groups or categories.
takes numerical values for which arithmetic operations such as
adding and averaging make sense.
of a variable tells us what values the variable takes and how often it takes these variables.
A variable is
any characteristic of an individual. A variable can take different values for
different individuals.
objects described by a set of data. Individuals may be people, but they
may also be animals or things.
places an individual into one of several groups or categories.
takes numerical values for which arithmetic operations such as
adding and averaging make sense.
of a variable tells us what values the variable takes and how often it takes these variables.
A categorical variable
places an individual into one of several groups or categories.
are objects described by a set of data. Individuals may be people, but they
may also be animals or things.
is any characteristic of an individual. A variable can take different values for
different individuals.
takes numerical values for which arithmetic operations such as
adding and averaging make sense.
of a variable plots each observation against the time at which it was
measured.
A quantitative variable
takes numerical values for which arithmetic operations such as
adding and averaging make sense.
places an individual into one of several groups or categories.
described by a set of data. Individuals may be people, but they
may also be animals or things.
is any characteristic of an individual. A variable can take different values for
different individuals.
of a variable tells us what values the variable takes and how often it takes these variables.
distribution
of a variable tells us what values the variable takes and how often it takes these variables.
are objects described by a set of data. Individuals may be people, but they
may also be animals or things.
is any characteristic of an individual. A variable can take different values for
different individuals.
places an individual into one of several groups or categories.
takes numerical values for which arithmetic operations such as
adding and averaging make sense.
To describe the overall pattern of a distribution, address all of the following:
a) ____________ – give the lowest and highest value in the data set
b) _____________– are there any values that stand out as unusual?
c) __________what is the approximate average value of the data (only an estimation)
d) ______________ – does the graph show symmetry, or is it skewed in one direction
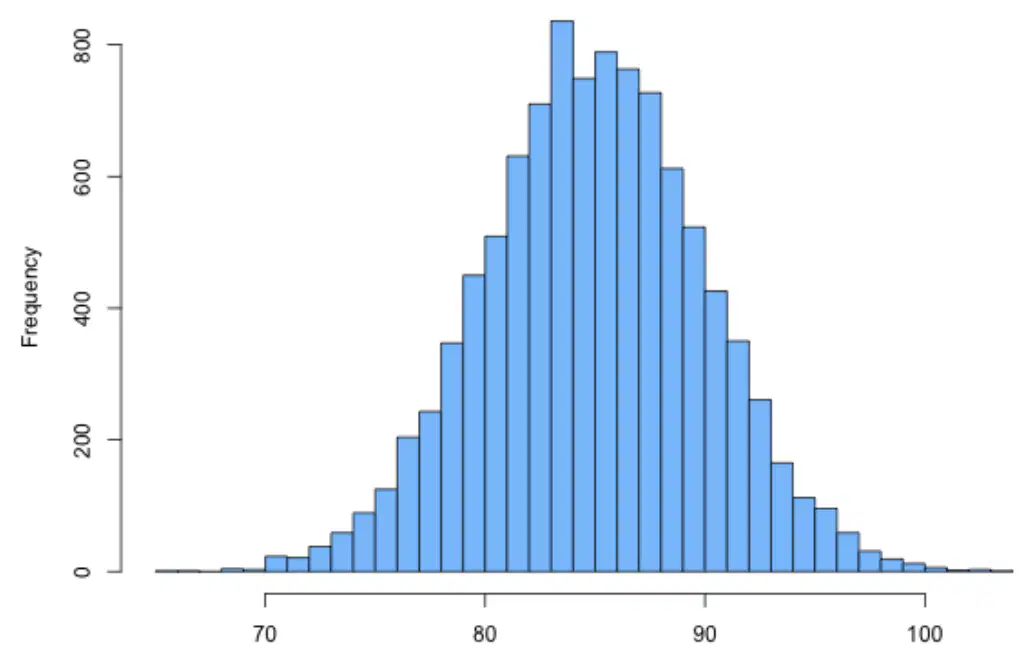
This graph best represents which of the following
SYMMETRIC
Uniform SYMMETRIC
BIMODAL
SYMMETRIC
SKEWED LEFT
SKEWED Right
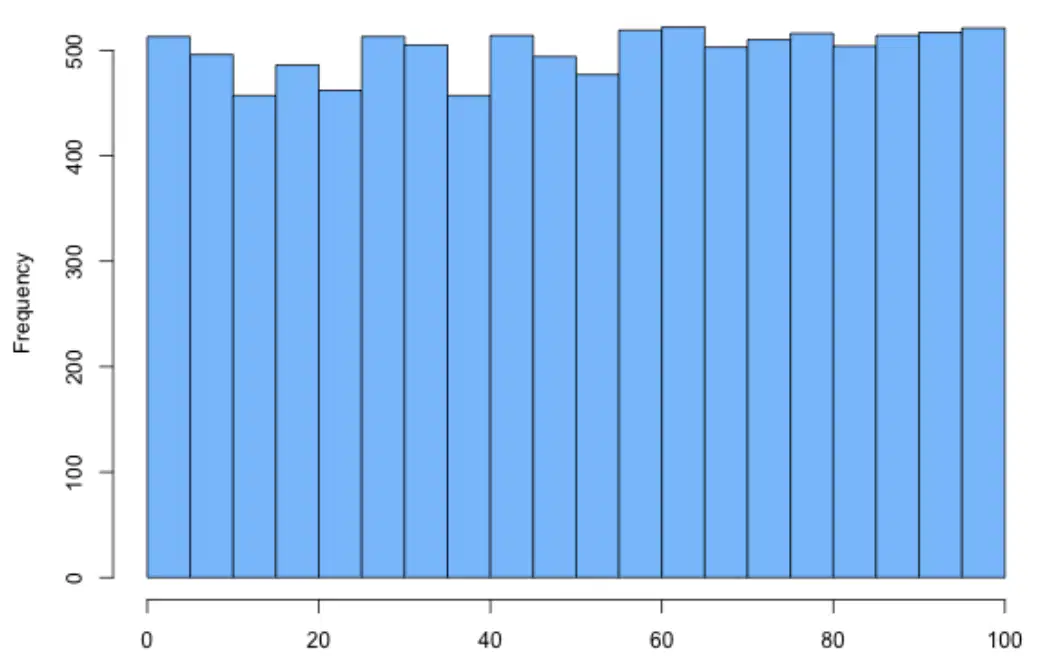
This graph best represents which of the following
SYMMETRIC
Uniform SYMMETRIC
BIMODAL
SYMMETRIC
SKEWED LEFT
SKEWED Right
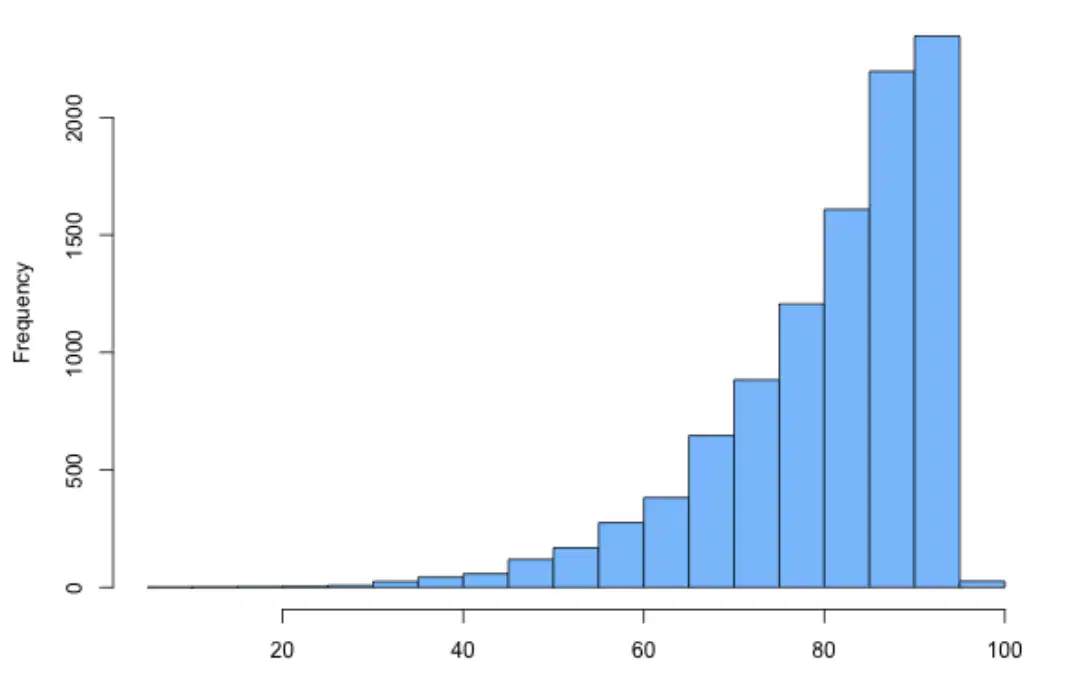
This graph best represents which of the following
SYMMETRIC
Uniform SYMMETRIC
BIMODAL
SYMMETRIC
SKEWED LEFT
SKEWED Right
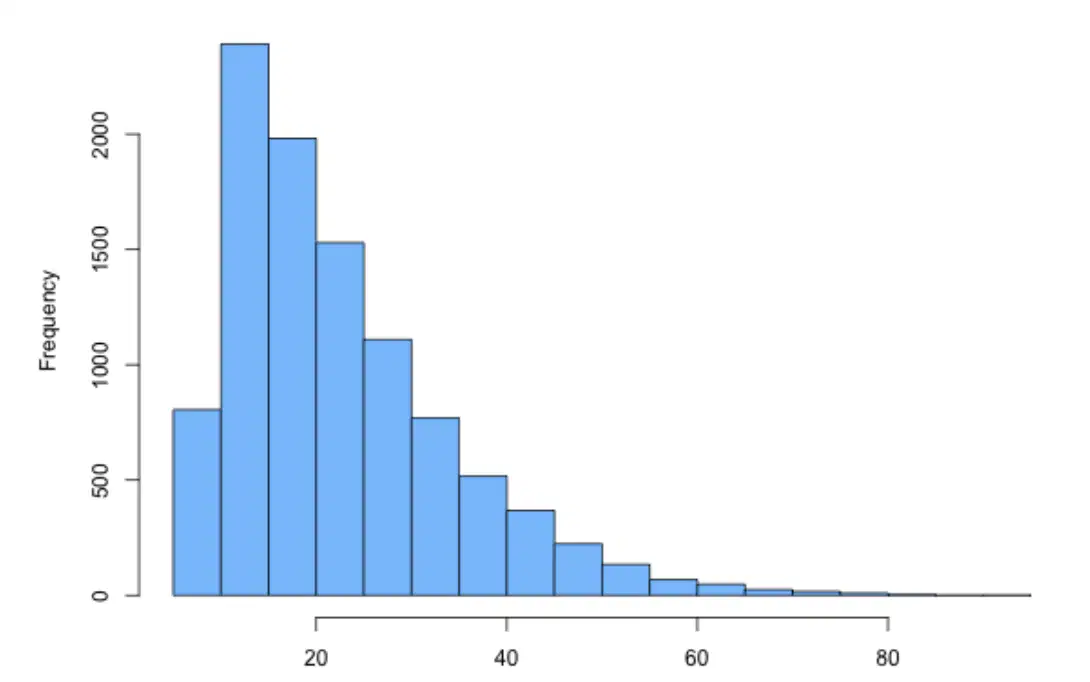
This graph best represents which of the following
SYMMETRIC
Uniform SYMMETRIC
BIMODAL
SYMMETRIC
SKEWED LEFT
SKEWED Right
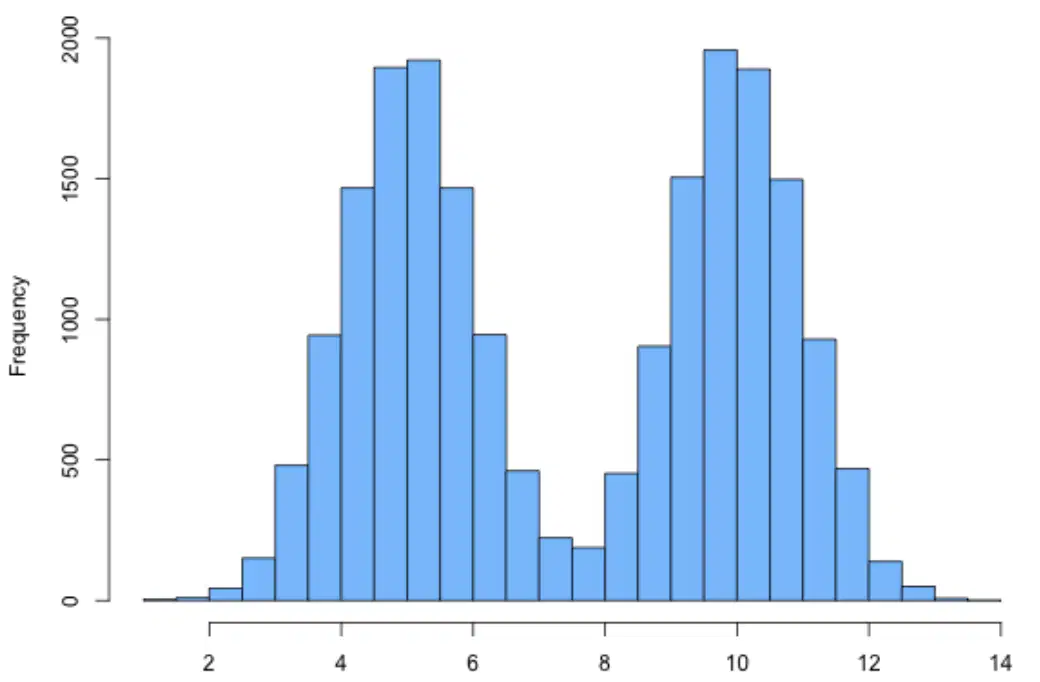
This graph best represents which of the following
SYMMETRIC
Uniform SYMMETRIC
BIMODAL
SYMMETRIC
SKEWED LEFT
SKEWED Right
The Five-Number Summary consists of which of the following.
Minimum–Q1 –Median–Q3 –Maximum
Minimum–Q2 –Median–Q4 –Maximum
Minimum–Q1 –Center–Q3 –Outlier
Lower Outlier–Q1 –Median–Q3 –Upper Outlier
Mean, Mode, Range, Outlier,Median
Which formula would help you determine the lower outliers?
Q1 - 1.5 IQR
Q2 + 1.5 IQR


(n + 1) / 2
Which formula would help you determine the upper outliers?
Q1 - 1.5 IQR
Q2 + 1.5 IQR
(n + 1) / 2

