
Font size
 Worksheets
Univariate Data SF
Total questions: 15
Worksheet time: 30mins
For the data set
165, 210, 220, 231, 232, 308, 427, 442, 451, 611
Calculate the five-number summary
165, 220, 308, 442, 611
165, 220, 270, 442, 611
165, 232, 442, 451, 611
165, 232, 427, 451, 611
For the data set,
1, 3, 8, 8, 9 ,15, 16, 21, 29, 55, 61
determine the outlier(s) and the value of the interquartile range.
IQR: 31.5
Outlier: 1
IQR: 31.5
Outliers: 55, 61
IQR: 21
Outlier: 61
IQR: 21
Outliers: 55, 61
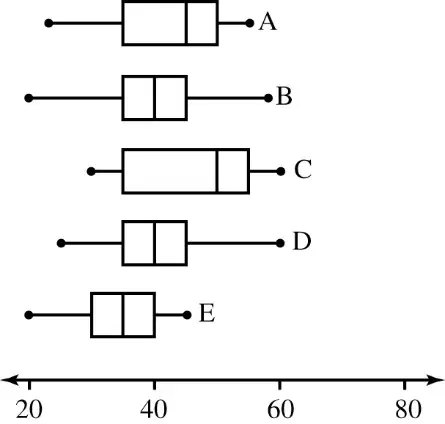
Identify the company with the largest interquartile range
Company A
Company B
Company C
Compant D
Company E
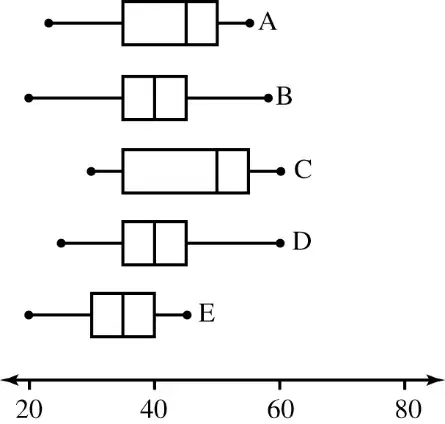
Identify the company with the lowest median.
Company B
Company E
Company C
Company A
Company D
Identify the type of data that would be collected from the following survey question
What are the different forms of transport used by Australians to travel to work?
Categorical Nominal
Numerical Discrete
Categorical Ordinal
Numerical Continuous
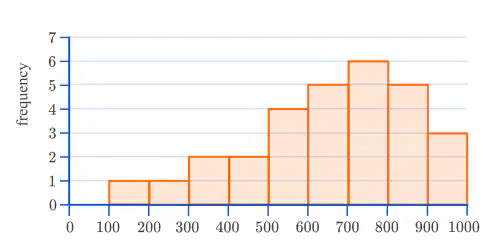
Identify the shape of the histogram.
Positively skewed
Negatively skewed
Symmetrical
Skewed to the right
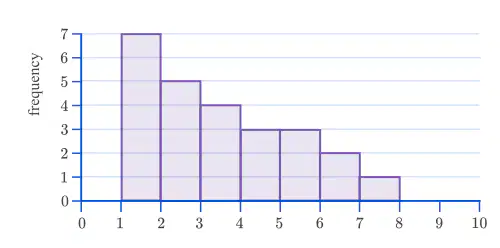
Mean is less than the median
Mean and median are equal
Mean is greater than median

Determine the standard deviation of the following dataset.
Round your answer to 1 decimal place
(a)
Outliers have the greatest effect on
Median
Mean
Mode
All of the above

The amount of push-ups a group of students in Class A could do during sports day is displayed in the following boxplot.
Another group of students from Class B performed the same task. The parallel boxplot has the same median, lower and upper quartile but with a range of 2525.
0
4
8
13.5
25
1
4
8
13.5
24
1
4
8
13.5
25
0
4
8
13.5
24

The number of team merchandise sold for two stores in a week is displayed in the following box plot.
Which statement is true about the sales for each store.
Group B has a higher median than Group A
Group A and Group B have the same range
Group A as a higher median than Group B.
Group A and Group B have the same median.
Identify the formula for the upper fence of the dataset.
Q1+1.5×IQR
Q3+1.5×IQR
Q1−1.5×IQR
Q3−1.5×IQR
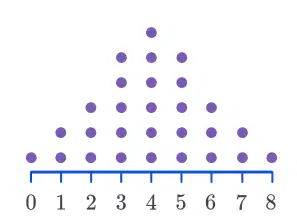
Identify whether the mean will be greater than, equal to, or less than the median in the distribution above.
mean is less than the median
Mena and median are equal
Mena is greater than the median
Jamie surveyed some 10001000 people about their income level, where low is $0−$44 999, medium is $45 000−$74 999, and high is $75 000+$75 000+.
Identify the most appropriate ways to display the data.
Column Graph
Frequency Distribution Table
Pie Chart
Histogram
Identify the label that represents the standard deviation on a calculator.
sx
σx
x
n

