
 Worksheets
3.4 - Measuring Productivity
Total questions: 10
Worksheet time: 17mins
Biomass is (select all that apply)
oxidized by respiration to provide energy
always the same throughout an organism's' life
never available for consumers to eat.
Is produced through photosynthesis in plants
The Total gain in energy or biomass per unit area per unit time by autotrophs.
Net Primary Productivity
Gross Primary Productivity
Secondary Productivity
Respiration
Which of the following is the correct equation for gross and net primary productivity
NPP = GPP - R
GPP = NPP - R
GPP = NPP / R
NPP = GPP/ R
NPP off the coast of California is 250g C/m2/year. Approximately 115g C/m2/year is lost through respiration. What is the GPP?
135
365
2.17
300
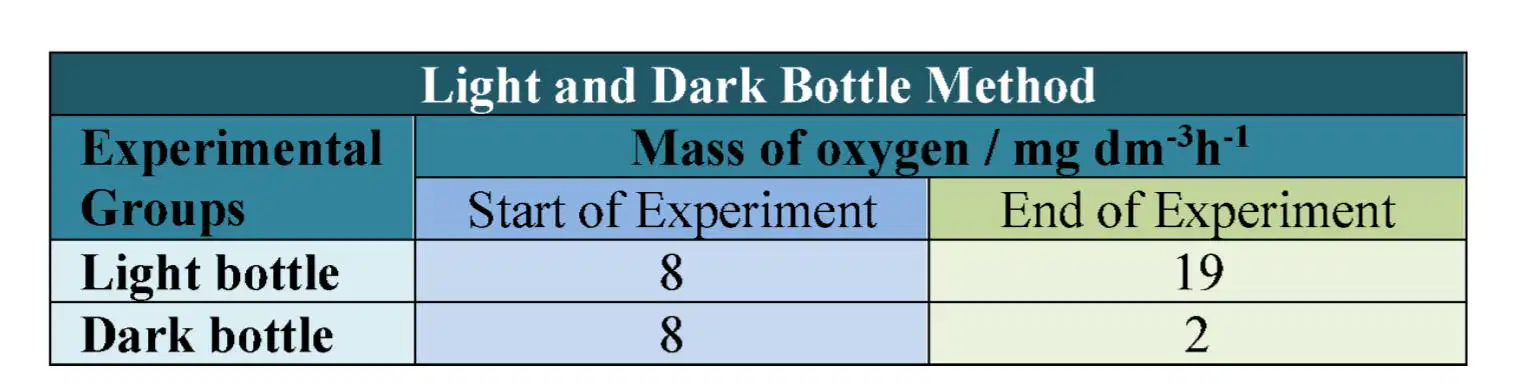
In the light and dark bottle method of measuring Productivity, the following results were produced. Calculate the respiration based on the data.
2mg O2 dm-3h-1
11mg O2 dm-3h-1
17mg O2 dm-3h-1
6mg O2 dm-3h-1
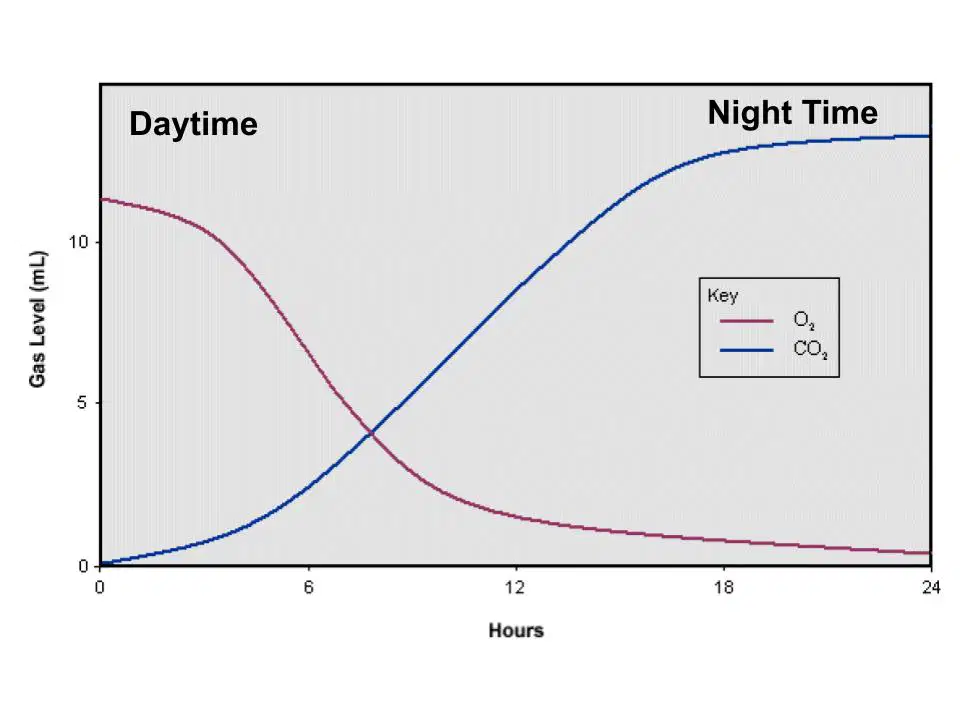
Explain the difference in oxygen and carbon dioxide levels between daytime and night time in this graph.
carbon dioxide will decrease at night without photosynthesis.
Carbon dioxide will decrease during the day due to photosynthesis.
Oxygen will increase at night due to more photosynthesis
Measuring productivity by monitoring changes in biomass is limited because
It does not account for the biomass consumed by herbivores.
biomass is added through photosynthesis in primary producers.
biomass is not easily measured or estimated.
biomass is not related to productivity
Which method of measuring productivity allows for large scale monitoring.
Biomass
Rate of Photosynthesis
satellite mapping
changes in carbon dioxide levels
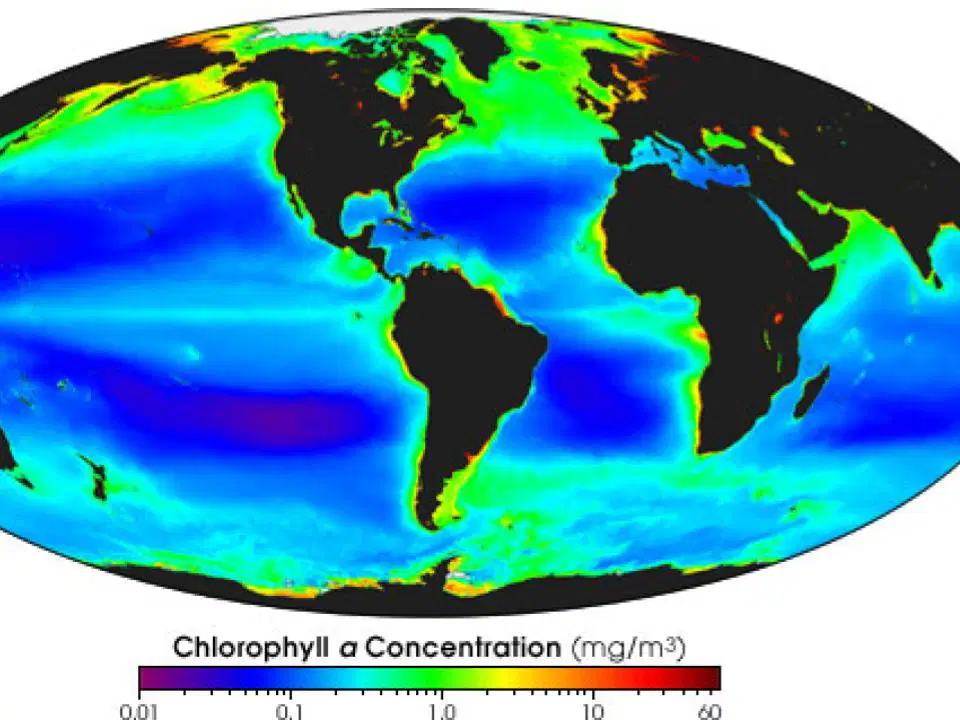
Based on the chlorophyll data in this image, what regions tend to have higher productivity.
Open ocean
Tropical Latitudes
Polar regions
Deep ocean
What is a limitation of satellite chlorophyll data
can't provide data on large areas
limited to shallow depths
limited to deeper depths
limited to nutrient availability

