
NEW
Font size
 Worksheets
B Functions Tables and Rate of Change 6AV
Total questions: 10
Worksheet time: 5mins

According to the table, what was the rate of change between 2013 and 2014?
1
2
3
4

According to the table, what was the rate of change between Thursday and Friday?
5
-5
6
-6

According to the table, what was the rate of change between Thursday and Friday?
6
-6
5
-5
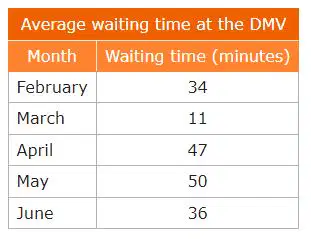
According to the table, what was the rate of change between February and March?
-22
-23
-24
-25
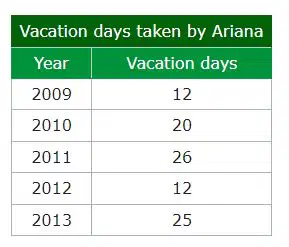
According to the table, what was the rate of change between 2009 and 2010?
8
9
10
12
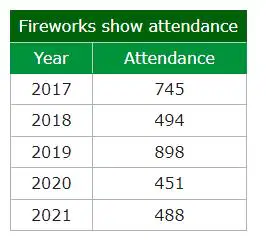
According to the table, what was the rate of change between 2017 and 2018?
-249
-250
251
-251

According to the table, what was the rate of change between 2020 and 2021?
9
10
11
12
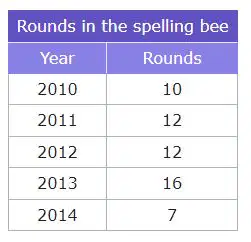
According to the table, when was the rate of change greater?
2010 to 2011
2011 to 2012
2012 to 2013
2013 to 2014
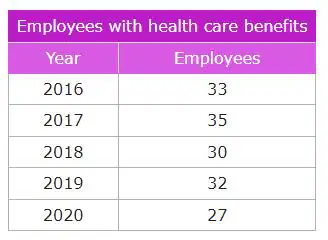
According to the table, when was the rate of decrease greater?
2017 to 2018
2018 to 2019
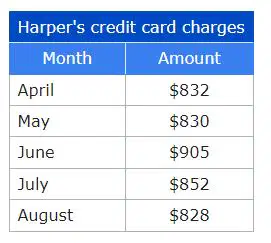
According to the table, when was the rate of decrease greater?
between June and July
between April and May

