
 Worksheets
Line and Bar Chart
Total questions: 124
Worksheet time: 2hrs 6mins
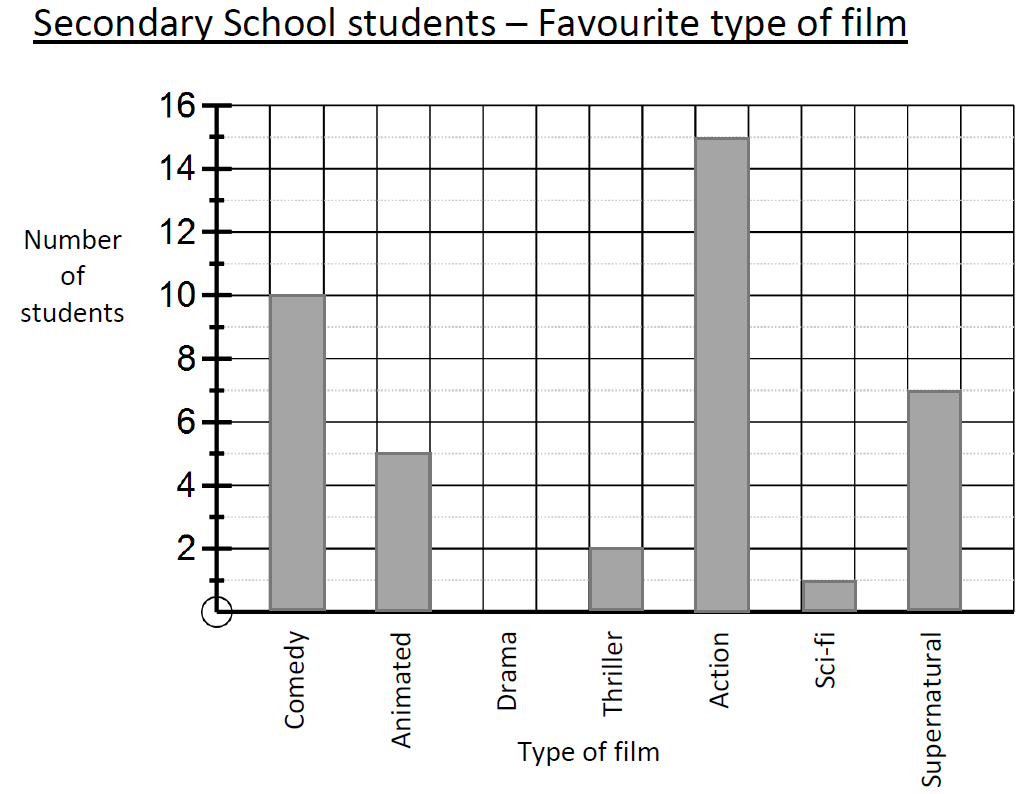
How many people said Drama was their favourite type of film?
0
2
1
7
How many people said Thriller was their favourite type of film?
0
2
1
7
How many people said Animated was their favourite type of film?
2
5
1
7
What was the most popular type of film?
Action
Comedy
Supernatural
Animated
How many more people said Comedy than Thriller as their favourite type of film?
2
5
8
10
How many more people said Action than Supernatural as their favourite type of film?
2
5
8
10

How many students spent between 30 and 60 minutes doing homework?
7
3
10
16
How many students spent between 120 and 150 minutes doing homework?
4
3
10
16
What was the most common amount of time that students spent doing homework?
30 - 60 minutes
60 - 90 minutes
90 - 120 minutes
120 - 150 minutes

How many employees walked to work?
22
8
10
12
How many employees travelled by bus to work?
22
8
10
12
How many employees travelled by car to work?
22
8
10
12
How many more employees travelled by car than by bicycle to work?
4
2
10
12
How many more employees travelled by bus than by bicycle to work?
4
2
10
12
How many more employees walked to work rather than cycled?
14
8
10
12
What was the most common mode of transport?
Walk
Cycle
Bus
Car

Which season is most popular?
(a)

Which season is least popular?
(a)

A total of 6 students said which season is their favourite?
(a)

How many students said winter is their favourite season?
(a)

In total, how many students took part in the survey?
(a)

Which colour is the least favourite colour?
(a)

Which colour is the second favourite colour?
(a)

Which colour is the favourite of 7 children?
(a)

Which 2 colours had a total of 12 children chose them as their favourite? Select two colours that total 12.
(a)

In total, how many students took part in the survey?
(a)

Which type of movie was most popular?
(a)

Which type of movie was least popular?
(a)

Which types of movie had an equal number of people choosing them as their favourite? Select more then one option.
Action
Comedy
Drama
Romance
Sci-fi

Action
Comedy
Drama
Romance
Sci-fi

In total, how many people took part in the survey?
(a)

How many mountain bikes were sold?
22
16
28
6

How many people voted for red as their favorite color?
100
4
2
9

How many more people have purple for a favorite color than red?
3
17
5
12

How many students scored Grade B?
3
5
12
10

How many students like Vanilla and Chocolate?
8
30
32
28

How may children voted for berry?
6
8
5
4

What colour do the pupils like most?


How many oranges are in the basket?
6
0
9
5

What type of graph is this?
pictograph
long graph
colour graph
bar chart

How many students take the bus to school?
35
20
10
15

What was the total number of games over the four weekends?
29
30
31
32

What was the total number of goals scored over the four weekends?
63
64
65
66

What was the average (mean) number of goals scored per game? Give your answer to one decimal point.
2.2
2.4
2.6
2.8

How many pupils attended only one after-school club?.
(a)

How many pupils are in Jaimik's class?
(a)

A class award is given in any week when pupils attend, in total, more than 40 after-school club sessions.
How many clubs in total did the class attend in total last week?
44
45
46
47

How many visitors were there in the first 5 days in total?
(Monday to Friday)
(a)

What was the average (mean) number of visitors on Wednesday, Thursday and Friday?
(a)

Tickets cost £2 from Monday to Friday but £2.50 on Saturday and Sunday. Find the total money from ticket sales in the last 7 days.
207
208
209
210
On the bar chart add the 3 missing labels under the axis

In the table add the missing category.

In the table add the missing data value.


The line chart indicates the sales of (a) different kinds of jam from 2009 to 2014.

Overall, it can be seen that all (a) of jam experienced an upward trend in sales except for plum during the given years.

In addition, strawberry remained the (a) popular kind with the highest figure in most of the period.

Starting at 3.2 million units in 2009, the sales of strawberry quickly increased and reached a (a) of 7 million at the end of the period.

Similarly, the figures for raspberry and grape witnessed the same pattern in which their sales grew considerably and stood at 5.5 million and 4.5 million (a) in 2014.

However, this number gradually dropped throughout the period and finally, no unit was (a) in 2014.

Regarding cherry, its sales saw a (a) around 2 million in the first four years.

the figure increased slightly (a) dropping to 2.5 million in 2014.

(a) at 3.2 million units in 2009, the sales of strawberry quickly increased and reached a peak of 7 million at the end of the period

(a) , the figures for raspberry and grape witnessed the same pattern in which their sales grew considerably and stood at 5.5 million and 4.5 million respectively in 2014

However, this number gradually dropped (a) the period and finally,

What is name of the chart pictured below?
Line Graph
Pie Chart
Bar Graph
Line Plot

What is name of the chart pictured below?
Line Graph
Bar Graph
Pie Chart
Line Plot

What is name of the chart pictured below?
Line Graph
Pie Chart
Bar Graph
Line Plot

What is name of the chart pictured below?
Pictograph
Pie Chart
Tally Chart
Line Plot

What is name of the chart pictured below?
Pictograph
Pie Chart
Tally Chart
Line Plot

What is name of the chart pictured below?
Pictograph
Pie Chart
Tally Chart
Line Plot

Which activity do 2nd graders like to do after school the most?
ride bikes
sports
read
watch tv
Which activity do 2nd graders like to do after school the least?
ride bikes
sports
read
watch tv
How many students like to watch T.V?
6
7
5
3
How many students voted for riding their bike and playing sports altogether?
10
11
12
13
How many students participated in this vote in all?
20
21
22
23

What desert had the least amount of votes?
fruit
yogurt
cake
icecream
What desert had the most amount of votes?
fruit
yogurt
cake
icecream
How many more votes did yogurt get than fruit?
0
1
2
3
How many students voted for cake and ice cream in all?
14
15
16
17

Observe the given image and choose the correct answer.
Scatter Chart
Pie Chart
Radar Chart

What activity did campers enjoy the most?
horseback riding
camp fire
crafts
canoeing
What activity did campers enjoy the least?
horseback riding
camp fire
crafts
canoeing




Which month did the restaurant sell 40 pizzas?
March
May
July
August

In which month the sale increased
July
June
May
August

How many centimeters of rain fell on the third day?
2
3
4
7

Graphs help us represent data
True
False
What helps organize data?
Table
Graph
Bar
Line



What percent of the annual sales were washers?
20%
30%
25%
0.20%
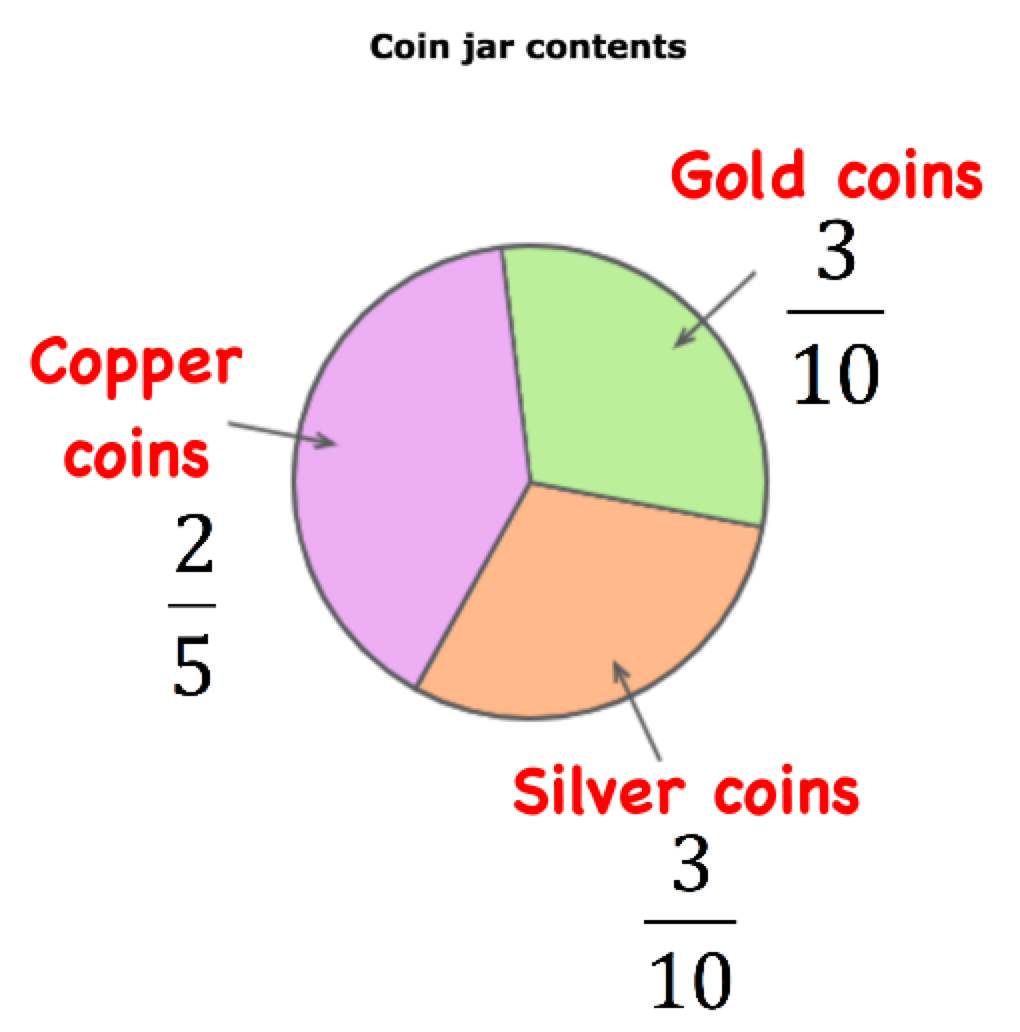
If there were 70 coins in the jar, how many of the coins are gold?
2
233
21
10

Which lists places the programmers in order from least productive to most productive?
Damon, Vince, Philippe, Travis
Philippe, Vince Damon Travis
Vince, Travis, Philippe, Damon
Damon, Philippe, Vince, Travis

What percent of people chose ski jumping?
10%
20%
15%
25%

The pie chart shows the colours of 32 beads. How many green beads are there?
90
8
11
9

How many birds are represented by the green sector?
5
20
9
13
What angle would you use to represent 42 blue cars out of 60 cars in total on a pie chart?
42 degrees
252 degrees
6 degrees
210 degrees
Annie recorded the amount of rain that fell each day. The results are shown in the line graph below. How many centimeters of rain fell on the third day?
2
3
4
7

What percent of the annual sales were washers?
20%
30%
25%
0.20%
If there were 70 coins in the jar, how many of the coins are gold?
2
233
21
10
Which lists places the programmers in order from least productive to most productive?
Damon, Vince, Philippe, Travis
Philippe, Vince Damon Travis
Vince, Travis, Philippe, Damon
Damon, Philippe, Vince, Travis
What percent of people chose ski jumping?
10%
20%
15%
25%
The pie chart shows the colours of 32 beads. How many green beads are there?
90
8
11
9
How many birds are represented by the green sector?
5
20
9
13
What angle would you use to represent 42 blue cars out of 60 cars in total on a pie chart?
42 degrees
252 degrees
6 degrees
210 degrees
Annie recorded the amount of rain that fell each day. The results are shown in the line graph below. How many centimeters of rain fell on the third day?
2
3
4
7

