
Font size
S
M
L
XL
 Worksheets
Drawing a Scientific Graph - revision quiz
Total questions: 12
Worksheet time: 11mins
Name
Class
Date
1.
How is the x-axis typically labeled in a scientific graph?
a)
The control variable
b)
The constant variable
c)
The independent variable
d)
The dependent variable
2.
What is the purpose of a scientific graph?
a)
To make the data more confusing
b)
To misrepresent the results
c)
To analyze and interpret data
3.
Which type of graph is best for showing numerical data over time?
a)
column graph
b)
Line graph
c)
Bar graph
d)
Pie chart
4.
What is the purpose of a title on a scientific graph?
a)
To label the axes
b)
To provide a description of the graph
c)
To make the graph look fancier
d)
To make the graph more colorful
5.
Which of the following are key components to include when drawing a scientific graph?
a)
Random colors
b)
Unclear labels
c)
Units for your variables
d)
An abstract image
e)
Title
6.
What are the two things you need to consider while labeling the axes of a scientific graph?
a)
The color and size of the label
b)
The landmark and distance
c)
The picture and name of the scientist
d)
The variable and its unit
e)
The origin and endpoint of the graph
7.
Which of the following are necessary for the accuracy of a scientific graph?
a)
Using a variety of colors for different data points
b)
Drawing large and impressive illustrations
c)
Including a picture of the experiment
d)
Ensuring that each data point is plotted correctly
e)
Including a legend if multiple data sets are represented
8.
What are the key aspects to consider when determining the scale for your graph?
a)
The maximum and minimum values of your data
b)
Your personal preference for large or small numbers
c)
The color of your data points
d)
The size of the graph paper
e)
The range of your data
9.
What 2 things must you do when drawing a graph?
a)
Use a ruler
b)
Label the x and y axis
c)
Plot data points in pen
d)
Join up the points like a dot-to-dot
10.
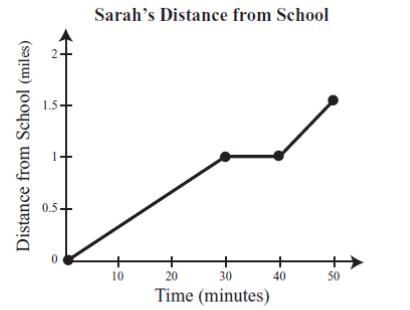
What is happening in the graph between 30 and 40 minutes?
a)
Sarah is accelerating
b)
Sarah is not moving
c)
Sarah is slowing down
d)
Sarah is travelling at a constant speed
11.

How many more people own cats than dogs?
a)
11
b)
3
c)
8
d)
5
12.
When drawing a line graph, the line we draw....
a)
is a freehand curved line that passes through all points
b)
is a ruled line that connects all the points
c)
is a freehand line that passes through the middle between the points
d)
is a line of best fit, drawn with a ruler
Reset

