
 Worksheets
1.1 - 1.2 Practice
Total questions: 52
Worksheet time: 3hrs 32mins

Find the point(s) of inflection (if it exists) of the graphed function.
No point of inflection
Points K, R, and S.
Points K and S
Points P, Q, K, R, S, and T
Points Q and T

Find the point(s) of inflection (if it exists) of the graphed function.
No point of inflection
Points 3 and 5
Points 1, 3, 5 and 7
Points 1, 2, 3, 4, 5, 6 and 7
Points 2, 4 and 6

Which of the following scenarios would best represent the graph shown?
Jackson ran to try and catch a bus at a stop near his house. He waited two minutes at the stop but realized he had missed the bus. So he slowly walked home.
Wesley walked to the end of his driveway to get the newspaper and then turned to walk back inside at the same constant rate.
Ben walked to a gas station close to his home to get a soda. He talked to some friends at the gas station for a few minutes. His mom called and told him to get home to do his Precal HW. The friend drove Ben back home. Luckily he got home faster in the car than when he walked.
Jenny and her friend took the escalator to the 2nd story of the mall, shopped there for a while, and took the escalator back down.
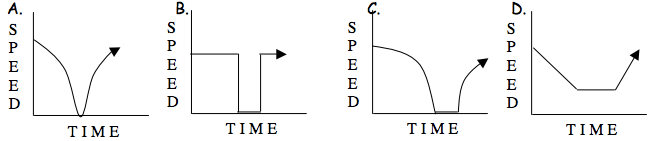
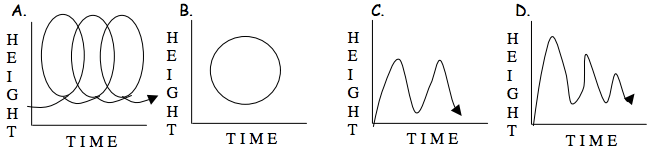
Which graph matches the given story:
The population size grows somewhat fast at first, and then the rate of growth slows.
None of the graphs pictured match the story.


Over which interval is the graph of f(x) both decreasing and concave up?
(B, C)
(D, E)
(C, D)
(H, I)

At which following point does the graph of f(x) appear to be transitioning from concave down to concave up?
B
E
G
H

How many extrema (maxes and mins) are in the picture?
2
3
4
5

On what intervals is f(x) increasing?
(- ∞, 0) & (2, ∞ )
(-1, 0) & (2,4)
(0,2) & (-3, -7)
(-8, -3) & (-7, 8)

What interval is f(x) < 0 ?
(1, 3)
(-∞, -2) U (-0.3, 2.2)
(-2, 1)
(-1, 1)

What do we call the point where concavity changes?
Maximum Point
Minimum Point
Inflection Point

Calculate the average rate of change from 20 to 40 minutes.
-2 minutes per gallon
-20 minutes per gallon
-2 gallons per minute
-20 gallons per minute

The Jamison family kept a log of the distance they traveled during a trip, as represented by the graph below. During which interval was their average speed the greatest?
the first hour to the second hour
the second hour to the fourth hour
the sixth hour to the eighth hour
the eighth hour to the tenth hour
What is the average rate of change of f(x) on the interval [-3, -2].

Find the point(s) of inflection (if it exists) of the graphed function.
No point of inflection
Points C, D and E
Points A, C, E and G
Points A, B, C, D, E, F and G
Points B and F
A function that is concave up can be
Increasing at a decreasing rate
Increasing at an increasing rate
Decreasing at a
decreasing rate
Decreasing at an
increasing rate
A function that is concave down can be
Increasing at a decreasing rate
Increasing at an increasing rate
Decreasing at a
decreasing rate
Decreasing at an
increasing rate

The following function is
Increasing at an increasing rate
Increasing at a decreasing rate
Decreasing at an
increasing rate
Decreasing at a
decreasing rate

The following function is
Increasing at an increasing rate
Increasing at a decreasing rate
Decreasing at an
increasing rate
Decreasing at a
decreasing rate

The following function is
Increasing at an increasing rate
Increasing at a decreasing rate
Decreasing at an
increasing rate
Decreasing at a
decreasing rate

What is the decreasing interval(s) on the function shown?
(−7, −6) and (−2, 4)
(−7, 0) and (−2, 4)
(−7, −6) and (−2, 0)
(−7, 0) and (4, 5)

On the interval of (0, 2) what is happening?
the graph is decreasing
the graph is increasing
the graph remains constant

Name the interval(s) in which the function is decreasing. Check all that apply.
(−7, −4)
(−4, −3)
(−1, 1)
(0, 2)
What is the decreasing interval(s) on the function shown?
(−7, −6) and (−2, 4)
(−7, 0) and (−2, 4)
(−7, −6) and (−2, 0)
(−7, 0) and (4, 5)
Which of the following graphs has the largest average rate of change from -1 to 2?


Describe the shaded region.
Decreasing Interval
Increasing Interval
Constant Interval
Positive Interval
Negative Interval

Describe the shaded region.
Decreasing Interval
Increasing Interval
Constant Interval
Positive Interval
Negative Interval

Describe the shaded region.
Decreasing Interval
Increasing Interval
Constant Interval
Positive Interval
Negative Interval

Describe the shaded region.
Decreasing Interval
Increasing Interval
Constant Interval
Positive Interval
Negative Interval

Describe the shaded region.
Decreasing Interval
Increasing Interval
Constant Interval
Positive Interval
Negative Interval

Describe the shaded region.
Decreasing Interval
Increasing Interval
Constant Interval
Positive Interval
Negative Interval

Describe the shaded region.
Decreasing Interval
Increasing Interval
Constant Interval
Positive Interval
Negative Interval

Describe the shaded region.
Decreasing Interval
Increasing Interval
Constant Interval
Positive Interval
Negative Interval

Describe the shaded region.
Decreasing Interval
Increasing Interval
Constant Interval
Positive Interval
Negative Interval

Describe the shaded region.
Decreasing Interval
Increasing Interval
Constant Interval
Positive Interval
Negative Interval

Describe the shaded region.
Decreasing Interval
Increasing Interval
Constant Interval
Positive Interval
Negative Interval

Name the interval that is BOTH positive AND decreasing for the entire interval.
(−7, −6)
(−1, 0)
(3, 6)
Name the interval that is BOTH negative AND decreasing for the entire interval.
(1, 3)
(−7, −6)
(−1, 0)
(3, 6)
Name the interval that is BOTH negative AND increasing for the entire interval.
(−6, −4)
(−7, −6)
(−1, 0)
(3, 6)
Name the interval that is BOTH positive AND increasing for the entire interval.
(−6, −4)
(−7, −6)
(−1, 0)
(3, 6)

List the types of intervals that the graph demonstrates in order.
decreasing, constant, increasing, constant
increasing, decreasing, constant
increasing, constant, increasing, constant
increasing, constant, decreasing, constant

Decreasing Interval
Increasing Interval
Constant Interval
Positive Interval
Negative Interval

Decreasing Interval
Increasing Interval
Constant Interval
Positive Interval
Negative Interval

Decreasing Interval
Increasing Interval
Constant Interval
Positive Interval
Negative Interval


What is m(4) if:
-3
0.5
0
-3.5
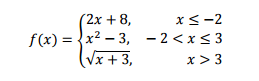
What is f(1)?
6
-2
sqrt(2)
Undefined

What is g(-2) if:
-7
7
1
-1

