
 Worksheets
Unit 1 Study Guide
Total questions: 91
Worksheet time: 3hrs 11mins
What shape is a normal distribution curve?
Half curve
Round curve
Bell curve
Square curve
According to the empirical rule, what percentage of data falls within 1 standard deviation?
25%
68%
95%
99.7%
According to the empirical rule, what percentage of data falls within 3 standard deviation?
25%
68%
95%
99.7%
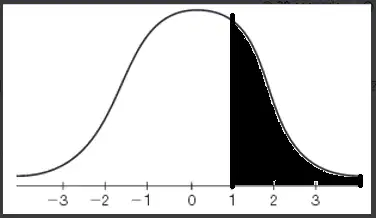
Which best describes the shaded part of this normal distribution graph?
All data that is one or higher.
All data that is one or more standard deviations above the mean.
All data that is between 1 and 3.
All data that is above the mean.
Between what two standard deviations of a normal distribution contain 68% of the data?
one below and one above
two below and two above
two below and zero
zero and two above
The Empirical (68-95-99.7) Rule can be applied only if data is _______
Normally Distributed
Uniform
Skewed
Symmetric
Use the following information and the Empirical Rule to estimate the answer.
The ages of golfers are normally distributed, with a mean of 38 and a standard deviation of 4. Find the percentage of golfers that are between 30 and 46 years old. (Remember to draw a curve with the values to help you.)
68%
94%
95%
99.7%
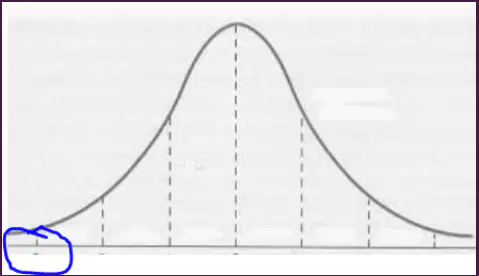
If this is the graph of data normally distributed with a mean of 30 and a standard deviation of 5, what label (number) is written at the blue circle?
20
15
40
30
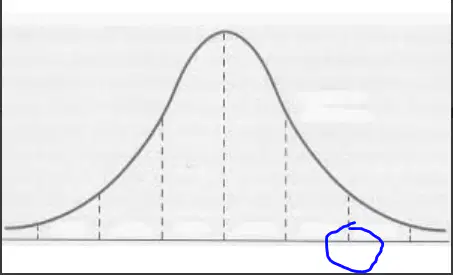
If this is the graph of data normally distributed with a mean of 30 and a standard deviation of 5, what label (number) is written at the blue circle?
20
15
40
30
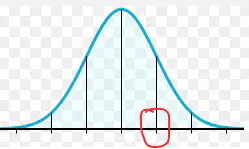
If this is the graph of data normally distributed with a mean of 30 and a standard deviation of 5, what label (number) is written at the red circle?
40
35
45
50
The normal curve is symmetrical about the mean.
True
False

This data is normally distributed. What percent of the data is in the shaded region?
68%
95%
99.8%
50%
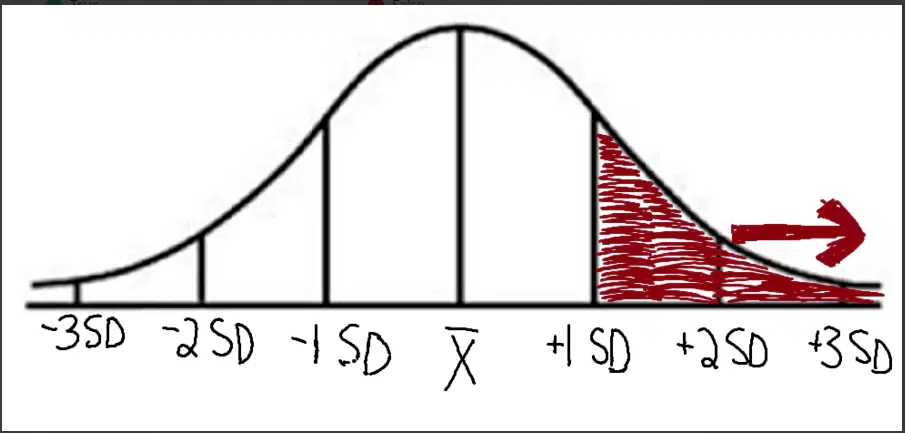
This data is normally distributed. What percent of the data is in the shaded region?
68%
32%
16%
50%
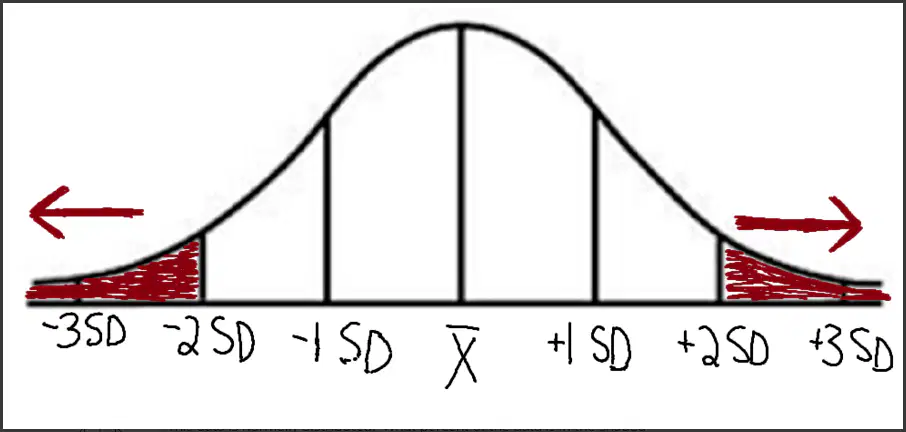
This data is normally distributed. What percent of the data is in the shaded region?
5%
95%
2.5%
50%

This data is normally distributed. What percent of the data is in the shaded region?
5%
2.5%
95%
50%
The mean life of a tire is 30,000 km. The standard deviation is 2000 km. Then, 68% of all tires will have a life between ___________ km and __________ km.
(Remember to draw a curve with the values to help you.)
28,000 km and 32,000 km.
24,000 km and 34,000 km.
26,000 km and 34,000 km.
27,000 km and 31,000 km.
The shelf life of a particular dairy product is normally distributed with a mean of 12 days and a standard deviation of 3 days. About what percent of the products last between 12 and 15 days?
(Remember to draw a curve with the values to help you.)
68%
34%
16%
2.5%
Which interval shows 95% of the data given a mean of 15 and a standard deviation of 3?
(Remember to draw a curve with the values to help you.)
9 to 21
12 to 18
6 to 24
13 to 16
Which interval shows 99.7% of the data given a mean of 15 and a standard deviation of 3?
(Remember to draw a curve with the values to help you.)
9 to 21
12 to 18
6 to 24
13 to 16
Which interval shows 68% of the data given a mean of 15 and a standard deviation of 3?
(Remember to draw a curve with the values to help you.)
9 to 21
12 to 18
6 to 24
13 to 16
In a survey of a sample of high school students, 43% said that their mother has taught them the most about managing money.
parameter
statistic
The average annual salary for 35 of a company's 1200 accountants is $68,000.
parameter
statistic
In a recent year, the interest category for 12% of all new magazines was sports.
parameter
statistic
In a recent year, the average math scores for all graduates on the ACT was 21.1.
parameter
statistic
A survey of 976 American households found that 32% of the households own two cars. Identify the the sample. {hint: a survey of what __)
All American households
976 American households
32% of Americans own two cars
two cars
What is the formula to find the z-score for population?
z=X-M
z=σ-M/μ
z/M=μ
z=X-μ/σ
The sign of the z-score indicates whether the location is above(positive) or below(negative) the mean.
True
False
Find the z-score value corresponding if the location is below the mean by 2 standard deviations
+2.00
-2.00
+1.25
-1.00
Find the z-scores value corresponding if the location is above the mean by 1/2 standard deviations
-0.50
+1.00
+0.50
-1.00
Find the Z-score.
Mean = 22
Standard Deviation: 3.1
x = 29
2.26
16.45
-2.26
1.26
Find the Z-score.
Mean = 21
Standard Deviation: 1.3
x = 22
0.77
5.33
1.07
1.26
Find the Z-score.
Mean = 27
Standard Deviation: 1.4
x = 11
-11.43
7.85
-2.33
4.16
Find the z-score.
Mean = 38
Standard Deviation: 1.2
x = 42
3.33
-3
3.03
-3.33
Find the z-score.
Mean = 45
Standard Deviation: 2.1
x = 50
2.38
3.00
3.08
2.33
Find the z-score.
Mean = 40
Standard Deviation: 1.4
x = 42
1.43
1.28
-1.4
1.24
Find the z-score.
Mean: 22.8
Standard Deviation: 7
x = 20
-0.4
17.2
22.04
32.5
Find the z-score.
Mean = 25
Standard Deviation: 7
x = 9.6
-2.2
-36
5.2
23.46
Find the z-score.
Mean: 16
Standard Deviation: 4
x = 11
-1.25
+1.25
16
21
Find the z-score.
Mean: 29.8
Standard Deviation: 7
x = 20
-1.4
10.2
-21
35
A data set has a mean of 290 and a standard deviation of 20. Calculate the z-score for 265.
z=250.5
z=1.25
z=−1.02
z=−1.25
A data set has a mean of 20 and a standard deviation of 3. Calculate the z-score for 23.
z=−1
z=16.33
z=1
z=3
A data set has a mean of 300 and a standard deviation of 40. What value would have a z-score of z=−2 ?
298
296
220
380
What does it mean to have a z-score of z=0 on a quiz?
It means you did better than zero people.
It means you scored the same grade as the average grade.
It means you earned a zero on the quiz.
It means the average score was a zero.

Use the image of the normal graph provided. What is the value of the mean?
6
34
52
70
Use the image of the normal graph provided. What is the value of the standard deviation?
6
12
36
18
A recent survey found that out of 400 random American adults, 89% pay their bills on time. The margin of error in this survey was 2%. What is the interval of values in which the truth is likely found?
89% - 91%
87% - 89%
87% - 91%
388 - 402
Why is a sample of 1000 people better than a sample of 100 people?
It reduces the margin of error.
It decreases bias.
Having more people is always better.
More people means that our results are more accurate.
You have a mean of 56 and a standard deviation of 4.3. What is +2 standard deviations from the mean?
60.3
47.4
51.7
64.6
What is the margin of error for the interval (6.8, 12.9)?
9.85
3.05
3.50
6.8
One group of subjects was given an herbal supplement and another group was given a placebo. After one year, the number of illnesses each group had was compared.
Observational Study
Experiment
A researcher stood at a school parking lot entrance to see if the color of a car is related to the driver not wearing a seatbelt.
Observational Study
Experiment
A professor finds that people who are obese have higher cholesterol levels than those who are not obese.
Observational Study
Experiment
You want to compare the health of students who walk to school to the health of students who ride the bus
experiment
observational study
A researcher randomly assigned boys and girls to each of two groups. One group was assigned to watch a violent television program while the other group watched a nonviolent program. The children's behavior was then recorded for incidences of aggressive behavior. This research method is best characterized as...
experimental
Observation
Researchers are investigating if girls type faster than boys. They record how long it takes for a SRS of 20 boys and 20 girls to type 500 words and compare the averages.
Survey
Observational Study
Experiment
Scientists track a flock of birds for three years to learn their migratory patterns.
Survey
Observational Study
Experiment
A teacher asks all her students five questions about their study habits.
Survey
Observational Study
Experiment
A teacher looks at his students tests to see which topics his students are still struggling with.
Survey
Observational Study
Experiment
A teacher asks all her students five questions about their study habits.
Survey
Observational Study
Experiment
A news station asked viewers to call in about their opinions about the construction of a new stadium.
Survey
Observational Study
Experiment
A librarian wants to know what genres of books are most popular. He looks up the top 100 checked out books in the library’s computer system.
Survey
Observational Study
Experiment
To determine how to vote on a bill, a senator calls random constituents to ask their opinion.
Survey
Observational Study
Experiment
A local restaurant has a link on the bottom of their receipts and asks guests to fill it out to help them improve their service.
Survey
Observational Study
Experiment
A farmer puts fertilizer on half his corn plans and no fertilizer on the other half. He determines which half produced more corn at the end of the season.
Survey
Observational Study
Experiment
A school wants to know what percent of their students ride the bus home. The bus drivers as asked to count the number of students they drive one day.
Survey
Observational Study
Experiment
You want to see if students who have a 4.0 grade point average study more than those who do not.
survey
observational study
experiment
To evaluate the defect rate of its memory chips, an integrated circuit manufacturer tests every 100th chip off the production line.
Biased Sample
Unbiased Sample
Students who wish to represent the school at a school board meeting are asked to stop by the office after lunch
Biased Sample
Unbiased Sample
A real estate agent surveys people about their housing preferences at an open house for a luxury townhouse.
Biased Sample
Unbiased Sample
To determine the most popular children’s programs, a television station asks parents to call in and complete a phone survey.
Biased Sample
Unbiased Sample
Airline boarding passes are marked with red stars at random to decide which passengers should have their carry-on luggage inspected.
Biased Sample
Unbiased Sample
To determine how often people eat out, every tenth person entering a Chinese restaurant is surveyed.
Biased Sample
Unbiased Sample
Biased or Random?
Isaac wants to find out the favorite foods of students at Churchill. He asks the boys’ basketball team about their favorite foods.
Biased sample
Random sample
Biased or Random?
You want to survey the students in your school about their exercise habits. At lunchtime you stand by a vending machine. You survey every student who buys something from the vending machine.
Biased sample
Random sample
Biased or Random?
Teliciah wants to determine the most popular brand of cereal in all of California. So she polls all the houses on her street to get a sample.
Biased sample
Random sample
Biased or Random?
Marissa wants to learn what the most popular board game in the United States is, so she creates a poll and shares it on Twitter.
Biased sample
Random sample
Biased or Random?
Justin wants to determine who the most popular Twitch/tv streamer in the United States is. So he hacks the U.S. Census and includes the question in the 2020 census form that goes to every household in America.
Biased sample
Random sample
Biased or Random?
Joey wants to determine the favorite candy among all 7th graders. So he asks all the people who sit in his row in Math class.
Biased sample
Random sample
Biased or Random?
Mrs. Locke wants to determine who the best teacher in all of Menifee County is, so he asks every 7th grader who their favorite teacher is.
Biased
Random
Determine if the question is random or biased. When it comes to pets, do you prefer dogs?
biased question
random question
Determine if the question is random or biased. What is your favorite season?
biased question
random question
Determine if the question is random or biased. Is green your favorite color?
biased question
random question
Determine if the question is random or biased. Is basketball your favorite sport?
biased question
random question
Determine if the question is random or biased. Do you want a delicious salad for lunch or the usual sandwich?
biased question
random question

