
 Worksheets
Bio1 Unit 1 Lesson 1 Mastery Check
Total questions: 30
Worksheet time: 2hrs 57mins
An experiment is carried out to determine if the boiling point of distilled water is affected by the addition of different types of solutes. Describe a control group for this experiment.
use different types of solutes for each group
measure the temperature that the water boils at
have a group with no solute added
change the amount of solute add to each group
A scientist is designing an experiment to see how temperature changes affect the volumes of three different gases. Which of the following is the best hypothesis for this experiment?
If the temperature increases, the volume of the gases will also increase.
Different gases will expand at different temperatures.
Decreasing the temperature will decrease the volume of the gas inside a balloon causing it to shrink.
The volume will be the greatest if the type of gas used is oxygen.
A scientist is designing an experiment to see how temperature changes affect the volumes of three different gases. Identify the role of each variable in the experiment.
Temperature of the Gas
Independent Variable
Volume of the Gas
Dependent Variable
Lowest Temperature of Gas
Control Group
Other Temperatures Used
Experimental Group
Type of Balloon Used
Controlled Variable
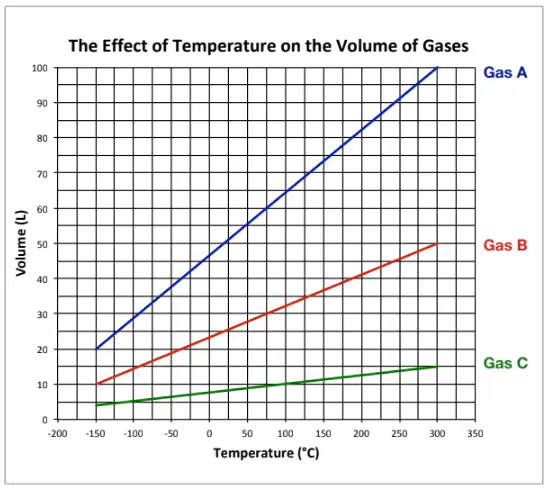
Gas A has a volume of 50L when its temperature is (a) ΄C.
At 50 ΄C, Gas B has a volume of (a) L.
If the temperature is lowered to –200 °C, Gas C would likely have a volume of (a) L.
Gas B would likely have a volume of 53L when its temperature is increased to (a) ⁰C
When hydrogen chloride (HCl) and ammonia (NH3) vapors react, they form solid ammonium chloride (NH4Cl):
HCl(g) + NH3(g) → NH4Cl(s)
A swab soaked with HCl solution was inserted into one end of a glass tube (1 cm diameter), and, simultaneously, a swab soaked with NH3 solution was inserted into the other end, so that the swabs were 10 cm apart. The distance that each vapor traveled could be determined because, at the point they made contact, a white ring of NH4Cl formed. The reaction was done at different temperatures. The time it took for the precipitate ring to start to form and its distance from the HCl swab were measured for each trial. The table for the data collected during the experiment is shown in the table.
Organize these options into the right categories.
temperature
distance from the HCl swab
distance from the HCl swab
distance from the HCl swab
time for the percipitate ring to start forming
distance between swabs
timing of swab placement
type of solution used

When hydrogen chloride (HCl) and ammonia (NH3) vapors react, they form solid ammonium chloride (NH4Cl):
HCl(g) + NH3(g) → NH4Cl(s)
A swab soaked with HCl solution was inserted into one end of a glass tube (1 cm diameter), and, simultaneously, a swab soaked with NH3 solution was inserted into the other end, so that the swabs were 10 cm apart. The distance that each vapor traveled could be determined because, at the point they made contact, a white ring of NH4Cl formed. The reaction was done at different temperatures. The time it took for the precipitate ring to start to form and its distance from the HCl swab were measured for each trial. The table for the data collected during the experiment is shown in the table.
Based on the results, which of the following graphs best shows the relationship between the temperature and the distance of the ring from the HCl swab?


When hydrogen chloride (HCl) and ammonia (NH3) vapors react, they form solid ammonium chloride (NH4Cl):
HCl(g) + NH3(g) → NH4Cl(s)
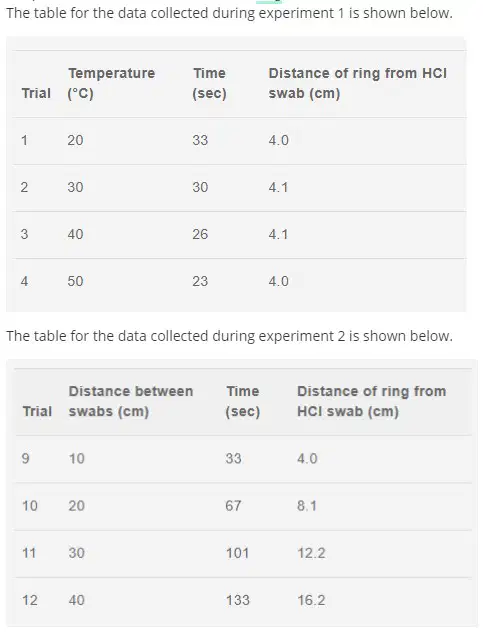
A swab soaked with HCl solution was inserted into one end of a glass tube (1 cm diameter), and, simultaneously, a swab soaked with NH3 solution was inserted into the other end, so that the swabs were 10 cm apart. The distance that each vapor traveled could be determined because, at the point they made contact, a white ring of NH4Cl formed. The reaction was done at different temperatures. The time it took for the ring to start to form and its distance from the HCl swab were measured for each trial.
The same experiment was done again, but this time longer tubes were used so that the distance between the swabs could be varied for each trial. The table for the data collected during the experiment is shown.
If a trial in Experiment 2 had been performed with the swabs 25 cm apart, the distance from the HCl swab to the ring would most likely have been closest to:
8 cm
10 cm
12 cm
14 cm
When hydrogen chloride (HCl) and ammonia (NH3) vapors react, they form solid ammonium chloride (NH4Cl):
HCl(g) + NH3(g) → NH4Cl(s)
A swab soaked with HCl solution was inserted into one end of a glass tube (1 cm diameter), and, simultaneously, a swab soaked with NH3 solution was inserted into the other end, so that the swabs were 10 cm apart. The distance that each vapor traveled could be determined because, at the point they made contact, a white ring of NH4Cl formed. The reaction was done at different temperatures. The time it took for the ring to start to form and its distance from the HCl swab were measured for each trial.
The same experiment was done again, but this time longer tubes were used so that the distance between the swabs could be varied for each trial. The table for the data collected during the experiment is shown.
The student concluded that NH3 diffuses at a greater rate than HCl. Do the results of experiments 1–2 support her conclusion?
No, the data shows that as the distance between swabs increased the ring formed farther away from the HCl.
Yes, the data shows that there is a positive correlation between temperature and distance the gas traveled.
No, the data shows that the time it took longer for the ring to form when the temperature was hotter.
Yes, the data shows that both time and distance increased as the distance between swabs increased.
When hydrogen chloride (HCl) and ammonia (NH3) vapors react, they form solid ammonium chloride (NH4Cl):
HCl(g) + NH3(g) → NH4Cl(s)
A swab soaked with HCl solution was inserted into one end of a glass tube (1 cm diameter), and, simultaneously, a swab soaked with NH3 solution was inserted into the other end, so that the swabs were 10 cm apart. The distance that each vapor traveled could be determined because, at the point they made contact, a white ring of NH4Cl formed. The reaction was done at different temperatures. The time it took for the ring to start to form and its distance from the HCl swab were measured for each trial.
The same experiment was done again, but this time longer tubes were used so that the distance between the swabs could be varied for each trial. The table for the data collected during the experiment is shown.
Which of the following best describes the difference between the procedures used in Experiments 1 and 2?
IV in Experiment 1 was temperature and in Experiment 2 it was the distance between swabs.
IV in Experiment 2 was temperature and in Experiment 1 it was the distance between swabs.
IV in Experiment 1 was the time for the precipitate to form and in Experiment 2 it was the distance the precipitate formed from the HCl swab.
IV in Experiment 1 was the distance the precipitate formed from the HCl swab and in Experiment 2 it was the time for the precipitate to form.

Based on the data in the table, how many students played the three games that had the highest frequency?
62
57
60
61

Based on the graph, how many more students are in the science club than the book club?
20
16
46
18

Which bar graph is the same as the data in the circle graph if 20 people were surveyed?


Which set of data best supports the claim that Field A has lower soil quality than Field B?
Figure 1
Figure 2
Table 1
Table 2

If 8 tons or fewer in crop yields were considered a failed harvest, in which year and in which field would there have been a failed harvest?
Field A in Year 1
Field A in Year 3
Field B in Year 4
Field B in Year 5

Suppose a new crop rotation for Field B included legumes and other deep-rooted and high-residue crops. The SOM of this field will most likely change in which of the following ways? The SOM will:
decrease, because soil quality is likely to increase.
decrease, because soil quality is likely to decrease.
increase, because soil quality is likely to increase.
increase, because soil quality is likely to decrease.

Table 1, if the amount of Fe2O3 produced on Day 9 had been measured for the salt solution, it would most likely have been
less than 0.56 g
between 0.59 g and 0.72 g.
between 1.23 g and 1.84 g.
greater than 1.84 g.
Which graph more accurately portrays the increase in crime for this city?


Which graph more accurately portrays the number of new stores added to a community.


Which graph more accurately portrays the increase in housing prices?


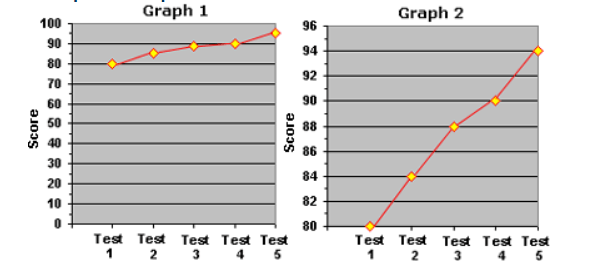
Alden wanted to impress his parents by showing the rapid increase in his score on 5 tests. Which graph should he use to impress them?
Graph 1
Graph 2
Neither
Both
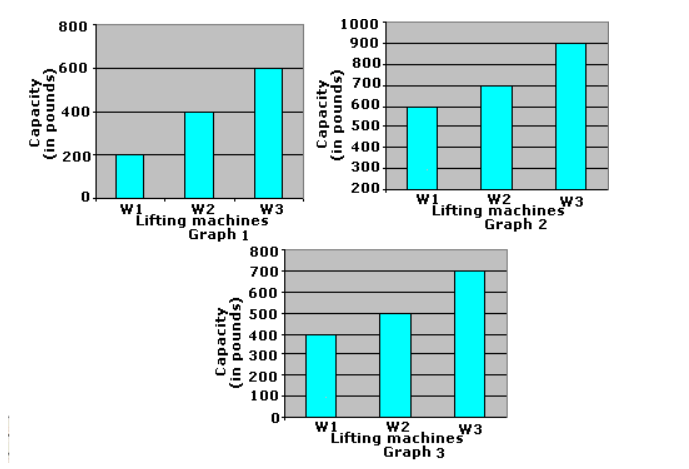
Which graph is misleading?
graph 1
graph 2
graph 3
graph 2 and 3


