
 Worksheets
Graph 2
Total questions: 10
Worksheet time: 10mins
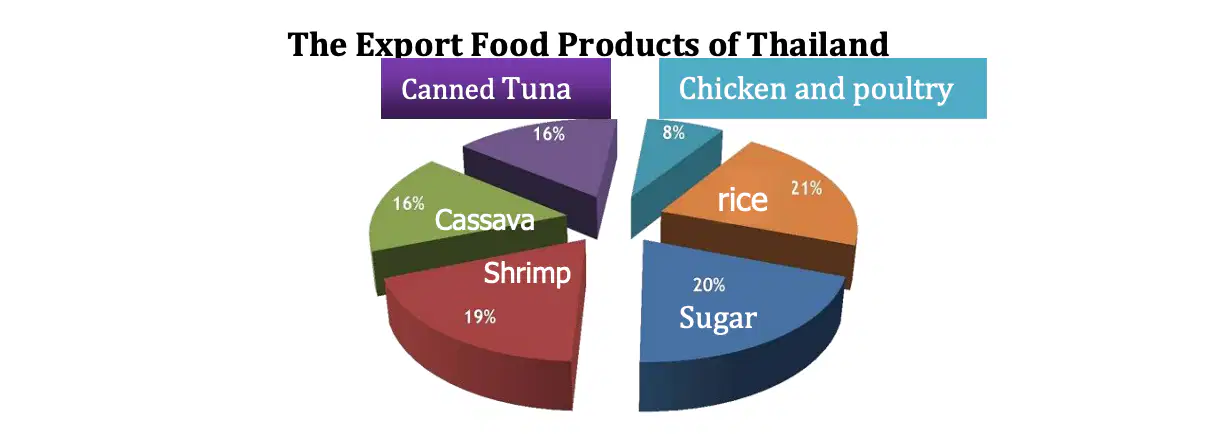
What kind of food was the most exported products of Thailand ?
shrimp
sugar
rice
chicken and poultry
What is true about the pie graph above ?
Thai land exported shrimp more than sugar.
Thailand exported cassava as much as shrimp.
Thailand exported chicken and poultry at a half number of canned tuna export.
Thailand exported cassava less than chicken and poultry
According to thepie chart , what kind of food product was least imported ?
canned Tuna
chicken a poultry
cassava
sugar
How many more percent of shrimp was exported than cassava?
5 percents
4 percents
3 percents
only 1 percent
What kind of food products were exported at the same percentage ?
rice and shrimp
cassava and shrimp
canned Tuna and cassava
shrimp and sugar

Most of the girls like __________.
English
Maths
Science
History
Most of the boys like __________.
English
Maths
Science
History
There are ………….………. more girls like Math than the boys.
one
two
three
four
The boys like History and Science……………………… than the girl.
more
less
most
least
There are 45 pupils in this class , there are .......... more boys than the girls.
three
four
five
six

