
Font size
 Worksheets
Kinematic review
Total questions: 25
Worksheet time: 45mins

A dog runs with an initial speed of 7.5 m/s on a waxed floor. It slides to a stop in 15 seconds. What is the acceleration? Caution: Vf is where the dog comes to a stop, 0 m/s.
-7.5 m/s
-7.5 m/s2
-0.5 m/s2
7.5 mi//hr

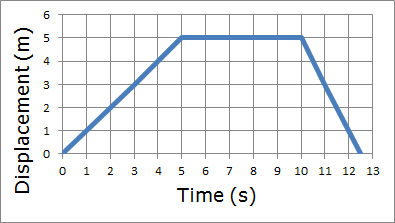
According to the graph, the rabbit has the greatest velocity during which interval?
0-5 s
5-10 s
10-15 s
15-20 s
Logan drives his monster truck 8 km east. He stops for lunch and then drives 5 km west. What was his displacement?
3 km east
13 km east
3 km west
5 km west
The slope on a position vs time graph represents
displacement
velocity
acceleration
cannot be determined
The slope on a velocity vs time graph represents
displacement
velocity
acceleration
cannot be determined
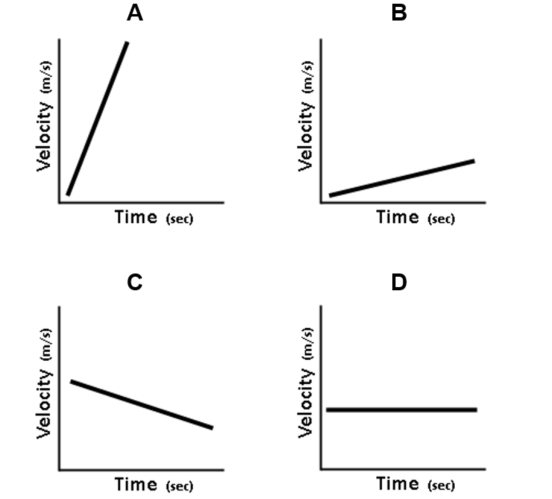
Which pair of graphs represents the same motion?


which of the following is a vector?
velocity
discance
position
speed
If a car passes you going 90 km/hr north while you are driving 80 km/hr north, how fast is the car moving relative to your car
170 km/hr N
10 km/hr N
170 km/hr S
10 km/hr S

What is happening at E?
Stationary
Accelerating
Fast steady speed; moving away from the starting position
Steady speed; returning to start position
What is happening at A?
Stationary
Accelerating
Fast steady speed; moving away from the starting position
Steady speed; returning to start position
What is happening at C?
Stationary
Accelerating
Fast steady speed; moving away from the starting position
Steady speed; returning to start position


Calculate the acceleration for segment A.
2 m/s2
20 m/s2
-2 m/s2
0 m/s2


What is happening from point O to A?
The object is slowing down
The object is speeding up
What is happening from point C to D?
The object is slowing down
The object is speeding up
The object is traveling at a constant velocity
What is happening from point A to B?
The object is slowing down
The object is speeding up
The object is traveling at a constant velocity

Look at the following distance vs. time graphs. Which graph(s) show positive acceleration?
Graph A
Graph B
Graph C
Graph D

