
Font size
 Worksheets
9/28/23 Warm-up
Total questions: 10
Worksheet time: 10mins
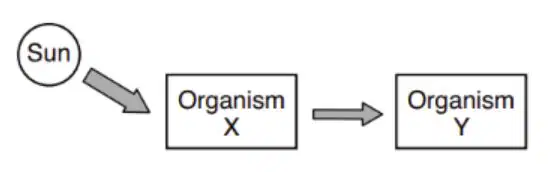
The model in the image summarizes one pathway of energy transfer in an ocean ecosystem. The type of organism represented by box X could be
algae
fungi
small fish
sea birds
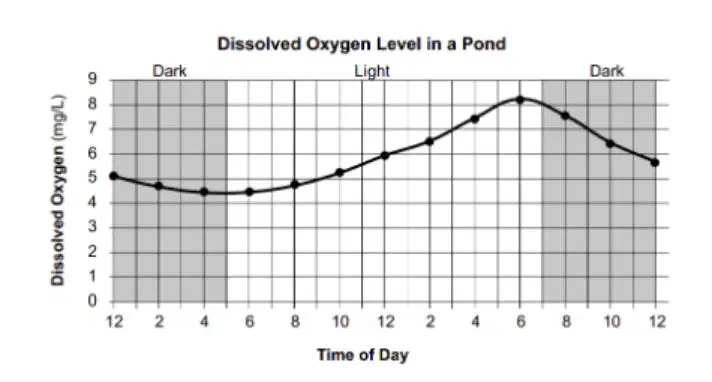
What is the most likely reason for the variation in the dissolved oxygen levels in the pond over the 24 hour period?
The increased light during the day decreases the oxygen produced by photosynthesis.
Photosynthesis produces more oxygen during the day than is used by respiration.
Respiration is reduced at night, so the oxygen produced by photosynthesis increases
More producers are active at night, so the dissolved oxygen increases.
A large population of fish was introduced into the pond. During which part of the day would these fish affect the dissolved oxygen level in the pond?
both day and night, because respiration is occurring all the time in plants and animals
nighttime, because no respiration is occurring
daytime, because that is when plants are most active
neither day nor night, because only plants produce oxygen
The removal of mitochondria from a typical animal cell would have an immediate effect on the cell's production of (a)
The image shows plant cells as seen under a microscope. The green pigment (a) is located within an organelle known as the (b) . These organelles are responsible for the conversion of (c) from sunlight into (d) stored in sugar molecules.
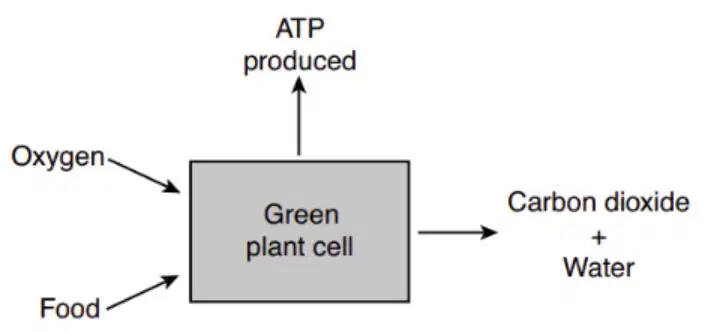
Which biological process is represented in the diagram?
photosynthesis
respiration
digestion
replication
Animal cells perform functions using energy that is derived from glucose. Which molecule is required for animal cells to obtain the most energy possible from a molecule of glucose?
water
oxygen
lactic acid
carbon dioxide
The diagram shows the interrelatedness of photosynthesis and cellular respiration. Drag and drop the molecules to the correct locations in the diagram. Not all answer choices will be used.
carbon dioxide and glucose
carbon dioxide and water
oxygen and water
oxygen and glucose

Students investigate how light intensity affects the rate of photosynthesis in an aquatic plant. Their setup is shown in the diagram. The students place a light at different distances from the plant and record the number of bubbles produced. Their data are shown in the table. Which inference is supported by the data?
The plant produces more oxygen as light intensity increases.
The plant takes in more water when the light intensity decreases.
The plant requires more energy for photosynthesis at lower light intensities
The plant needs less carbon dioxide for photosynthesis at higher light intensities.
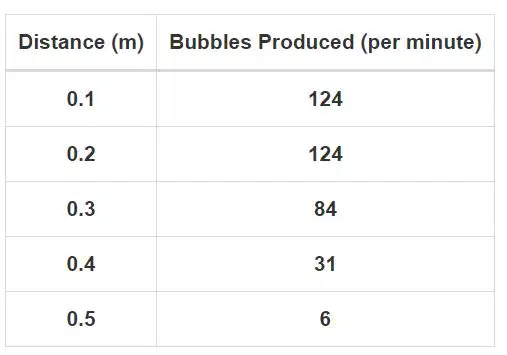
Students investigate how light intensity affects the rate of photosynthesis in an aquatic plant. The students place a light at different distances from the plant and record the number of bubbles produced. Their data are shown in the table. Which graph shows the relationship between the rate of photosynthesis and light intensity?



