
 Worksheets
Tallies and Picture Graphs
Total questions: 11
Worksheet time: 8mins
Name
Class
Date
1.

How many students favorite pet was a cat?
a)
5
b)
10
c)
4
d)
15
2.

How many more people like the color purple than blue?
a)
1
b)
3
c)
6
d)
8
3.
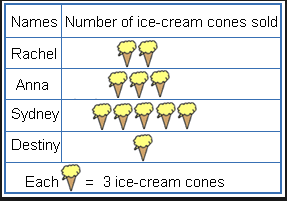
How many cones were sold in all?
a)
16
b)
21
c)
11
d)
33
4.

How many books did the class read in May and July?
a)
70
b)
25
c)
65
d)
75
5.

What does this graph tell you?
a)
How students like to play.
b)
How students get to school.
c)
How they get to work.
d)
If they can drive.
6.

The picture graph shows the number of stamps collected by some boys.
Who collected 15 stamps?
a)
All of them
b)
Bala
c)
John
d)
Peter
7.

Which fruit did most children choose?
a)
apple
b)
banana
c)
grapes
8.
How do you group tally marks together?
a)
by ones
b)
by twos
c)
by threes
d)
by fives
9.

How many fewer children chose science than math?
a)
2 children
b)
4 children
c)
5 children
10.

How many more people chose ladybug than bumblebee?
a)
3
b)
5
c)
4
11.

Katie asked her friends their favorite food. Select the number of tally marks for Hot Dog.
a)
3
b)
4
c)
5
d)
6
100 %

