
Font size
 Worksheets
Grade 7 (MAP )
Total questions: 25
Worksheet time: 32mins
Scientists and engineers work together to try to reduce the damage from natural hazards. Which term is used to describe this process?
Mitigation
Technology
Scientific method
Controlling variables
What is the best method for a geologist to find a scientific explanation for varying levels of damage in a city after an earthquake?
Review local newspaper reports
Conduct a survey of residents in each area
Create a computer model that takes into account different variables
Analyze the strength of previous earthquakes
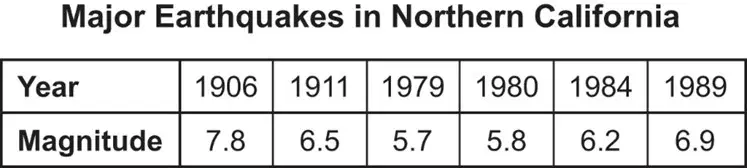
This data table shows information about earthquakes in Northern California. Which strategy is the most practical way to mitigate damage to buildings as a result of earthquakes in this area?
Research methods of preventing earthquakes from happening
Educate the public about how to respond in case of an earthquake
Research methods of designing buildings to withstand earthquakes up to magnitude 8.0
Design early detection systems to know when an earthquake larger than magnitude 5.0 will happen next
Which data is most helpful in predicting volcanic activity?
Sea surface temperatures and wind speed
Satellite data about atmospheric conditions
Historic information about landslides and flooding
Frequency of earthquakes and stability of land surface
A scientist wants to track a hurricane and predict where it will go next. Which tools are best for making predictions about hurricanes?
Thermometers and GPS
Geologic maps and tiltmeters
Satellites and computer models
Weather balloons and seismometers
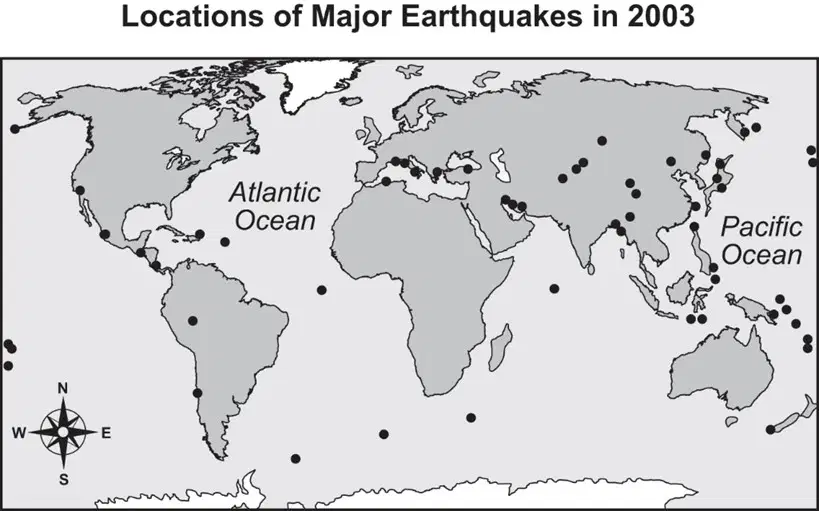
During the year 2003, the number of earthquakes that occurred was higher than usual. The map shows the locations of some of these earthquakes. Which question does the information on this map help answer?
How often do earthquakes happen?
When will the next earthquake happen?
Where are earthquakes likely in the future?
What will be the strength of the next?

Tornadoes and flooding are two natural hazards that affect parts of the United States. The map combines data showing the locations where tornadoes were reported in the spring of 2019 and the places where flooding was expected in 2019. Circle the letters of all of the statements that are supported by the data.
The data show that tornadoes cause flooding.
The risk areas for tornadoes and floods overlap in many places.
The areas where major floods were expected are the areas where the highest number of tornadoes were reported.
The risk for major floods is affected by geologic features as well as by weather.
Floods and tornadoes both have similar risk areas because both hazards share some of the same underlying causes.
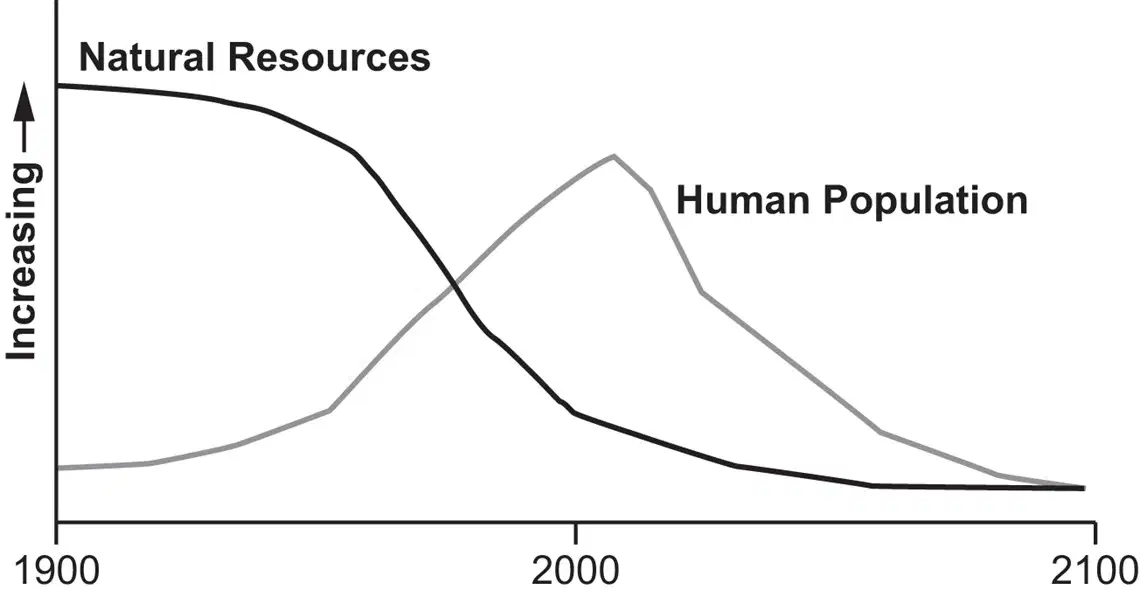
After studying many factors in the environment, a scientist developed this graph to predict changes in human population and natural resources. What is the role of science in this study?
To develop government policies to reduce the use of resources
To set costs for natural resources according to their availability
To predict the effects of human population on natural resources
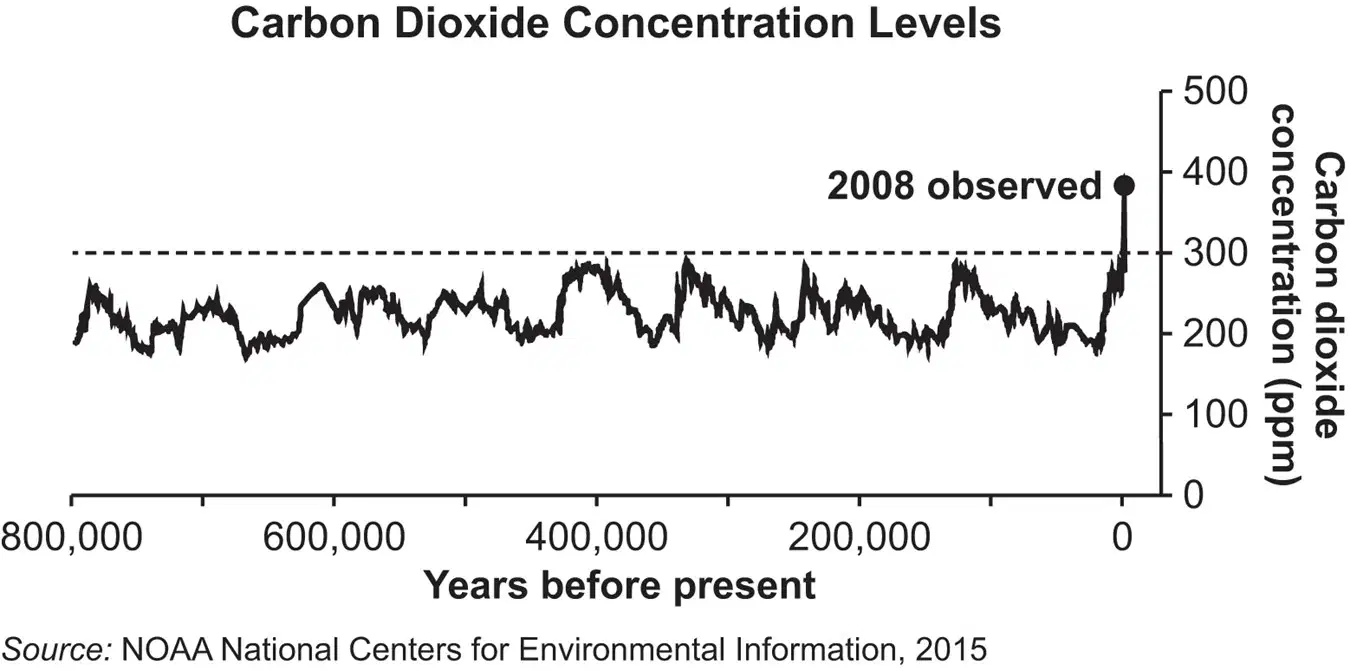
Natural events, such as volcanoes, trapped gas in ice, and decaying plants, have added CO2 to the air. Humans burning coal since the early 1800s has also added CO2 to the air. The graph shows the amount of carbon dioxide in the atmosphere for the past 800,000 years. Which statement is supported by the data in the graph and the information in the paragraph?
The CO2 levels increased when humans began to burn fossil fuels
CO2 levels have increased in the past 200 years because of volcanic activity
The CO2 levels at 200,000 years ago are greater than the levels at 400,000 years ago

A man has a new job that requires him to move to one of four places: Hawaii, Maine, Texas, or Wyoming. The man wishes to live in an area at low risk for earthquakes. This United States map shows the probability of seismic activity that could result in earthquakes. Based on this map, where should the man move for his new job?
The southeastern part of the state of Texas
The northeastern portion of the state of Maine
The easternmost island in the state of Hawaii
Possible methods to reduce the use of nonrenewable resources are listed. Circle the letters of all the correct methods.
The addition of more coal-based power plants
The construction of wind turbines in rural areas
The use of solar panels on homes and businesses
The use of natural gas to heat government buildings

The graph shows how the amount of sunlight reaching Earth's surface was changed by several volcanic eruptions. Which statement describes the relationship between volcanic activity and net solar radiation?
After some volcanic eruptions, solar radiation levels suddenly drop and then rise again
Decreases in solar radiation due to volcanoes occur gradually, and the increases occur suddenly
After a volcanic eruption, solar radiation reaching Earth's surface first increases and then decreases
Which scientific instrument is used to help predict volcanic eruptions?
Barometer
Microscope
Seismograph
Anemometer
Which natural hazard is caused by an underwater earthquake?
Tsunami
Waterspout
Mass wasting
Volcanic eruption
Which of these is most responsible for global deforestation?
Forest fires
Climate change
Increased need for furniture
Increased demand for agriculture

The map shows the path of a hurricane as it moves north in three days and the forecasted path for two following days. The strongest hurricanes are rated 5 and the weakest storms are often called tropical depressions. Circle the letters of all of the conclusions that can be drawn from this map.
The storm caused more damage in Tennessee than in Florida.
The impact of the storm in Alabama was similar to the impact of the storm in Florida.
The hurricane became stronger when it traveled over water than when it traveled over land.
The storm was weaker when it passed over Florida than over Louisiana.
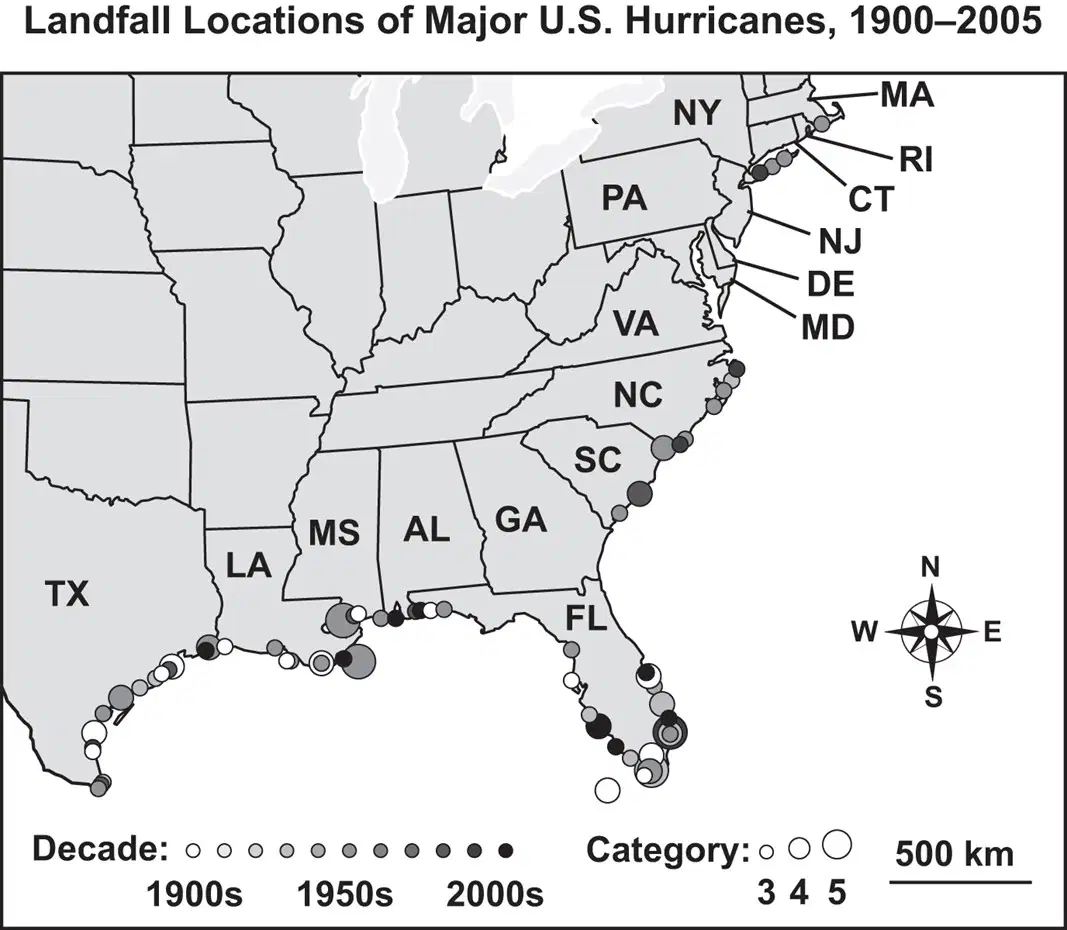
Hurricanes in the Atlantic Ocean can make landfall in any state along the Gulf or East Coast of the United States. The map shows the landfalls of major U.S. hurricanes from 1900 to 2005. Which states are most likely to experience the strongest hurricanes?
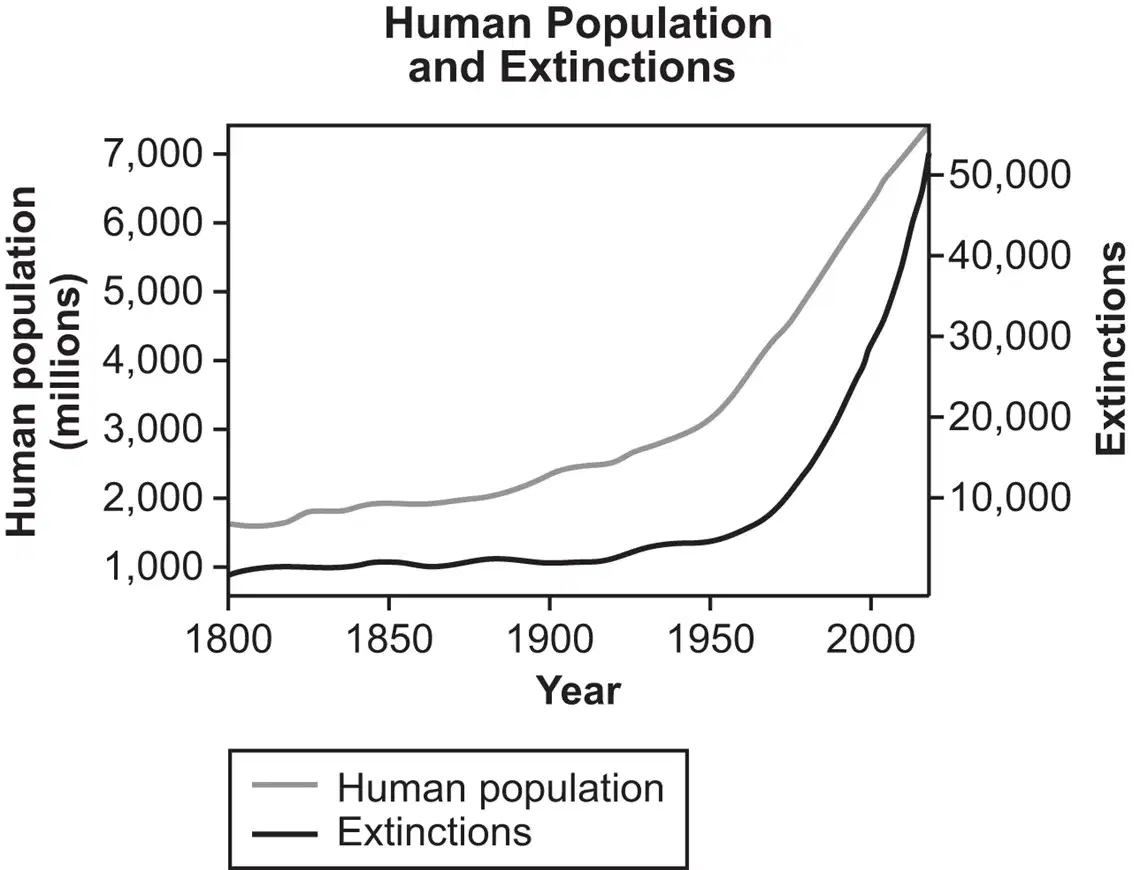
The graph compares the human population to the total number of species that have gone extinct over time. Which statement is not supported based on this graph?
As the human population increases, the rate of extinctions is not affected
Water and air become polluted at higher rates as the human population grows
Animal habitats are destroyed to make space for homes as the number of humans on Earth increases
Studies have shown that as the human population increases, the destruction of habitats increases also. Which statement describes a likely outcome of habitat destruction?
Many species will go extinct
Many new species will evolve quickly
The population of many species will increase
A group of scientists plans to study changes in global temperature over time. Circle the letters of the questions that temperature data will help answer.
How is the sea level along the continental coasts changing?
How is the area of Earth that is covered by glaciers changing?
How is the number of animal species in the United States changing?
How is the location of earthquakes in the United States changing?

The graph shows how much new carbon dioxide (CO2) was added to the atmosphere each year. The new CO2 comes from three sources: fossil fuels, forest fires, and ocean water. Fossil fuels and forests give off CO2 when people burn them. Ocean water gives off CO2 as it warms up. Which statement is supported by the data?
Forests do not absorb CO2 from the atmosphere
Ocean water does not add any CO2 into the atmosphere
Fossil fuels are the main source of rising CO2 levels every year
Which natural hazard often causes another natural hazard?
An earthquake often causes a drought.
A forest fire often causes a flood.
A hurricane often causes a flood.
A place where an earthquake originates is called the _
Focus
Tsunami
Fault Line
Epicenter
Earthquakes occur most frequently at
Plate surface
Plate boundaries
Plate vacuum
Ocean beds
Which of the following is a Terrestrial Disaster?
Blizzards
Earthquakes
Floods
Viral diseases

