
 Worksheets
Week 1 Quiz
Total questions: 10
Worksheet time: 4mins
Name
Class
Date
1.

Why do statistics matter in business?
a)
Increase Revenue
b)
For Vibes
c)
Employee Satisfaction
d)
Risk Management
e)
Solve complex formulas
2.

What's the definition of a population?
a)
The entire set of individuals, items, or data under consideration in a statistical study
b)
Group of people
c)
A lot of numbers put together in a format
d)
Set of items that are organised in a tabular format
e)
A group of complex formulas that will summarise data
3.

Which is not a fundamental concept of statistics?
a)
Population
b)
Sample
c)
Variable
d)
Formulas
e)
Parameters
4.

What is an example of Ordinal Data?
a)
Car models
b)
Income
c)
Customer Satisfaction Rating
d)
Temperature
e)
Name
5.

Which of these are types of data?
a)
Nominal
b)
Internal
c)
Ordinal
d)
Interval
e)
Fun
6.

Which statement best defines Inferential Statistics?
a)
Techniques used to summarize and describe data. Examples include measures of central tendency (mean, median, mode) and measures of dispersion (variance, standard deviation).
b)
Takes historical data and feeds it into a machine learning model that considers key trends and patterns.
c)
Techniques used to make predictions, inferences, or decisions about a population based on a sample. It includes hypothesis testing and confidence intervals.
d)
Takes predictive data to the next level. Now that you have an idea of what will likely happen in the future, what should you do?
7.

Which of these are Ethical Considerations you may encounter in a data analysis project?
a)
Bias
b)
PII
c)
Password Protected
d)
Transparency
e)
Accuracy
8.

Which of these are examples of Measures of Central Tendacny?
a)
Mean
b)
Standard Deviation
c)
Variance
d)
Mode
e)
Median
9.
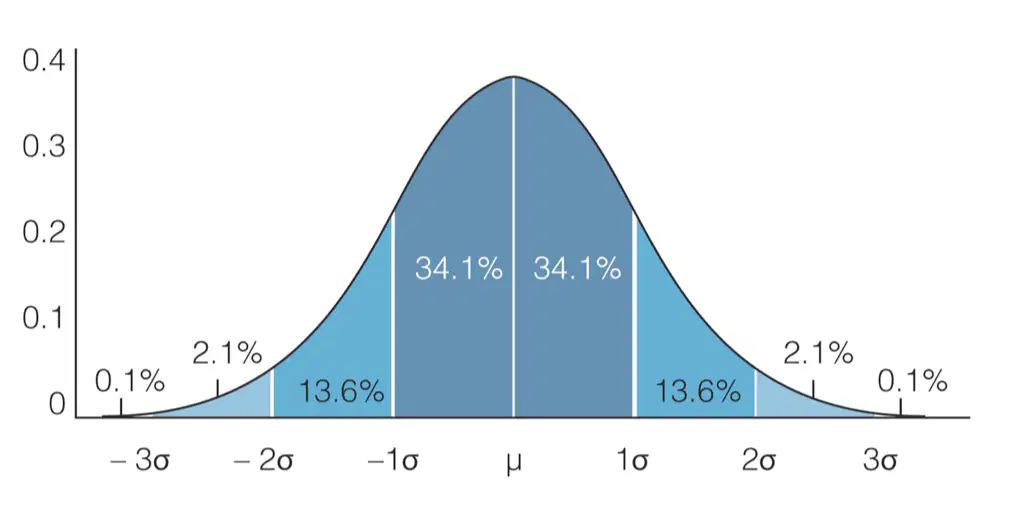
What is the definition of Variance?
a)
Highest value takeaway the lowest value
b)
Sum of all the values divided by the number of data points
c)
Measures the average of the squared differences between each data point and the mean. It quantifies the degree to which data points deviate from the mean.
d)
The middle value
e)
The square root of the variance. It measures the average distance between each data point and the mean.
10.
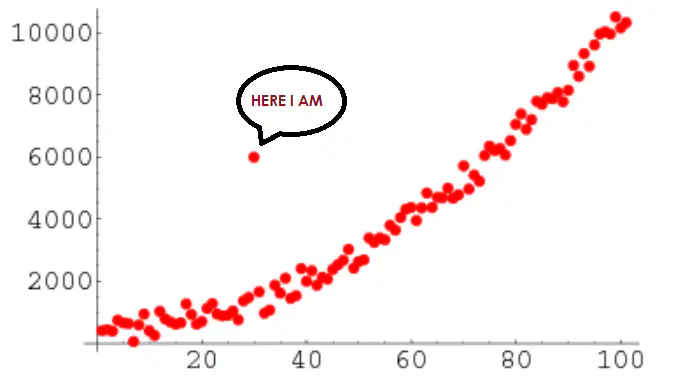
Which of these are examples of handling outliers?
a)
Visualisation
b)
Model-Based Approach
c)
Dropping the nulls
d)
Transforming Data
e)
Ignoring them
100 %

