
NEW
Font size
 Worksheets
Speed, Velocity, Acceleration, Forces
Total questions: 17
Worksheet time: 4hrs 15mins


To calculate net force you must
Add the forces
Subtract the forces

In a tug of war game, the NET FORCE is 50N to the LEFT. The winning team pulled with a force of 200N to the left. How much force did the losing team pull with?
150N right
250N right
100N right
50N right
Suppose you walked 80 meters in 40 seconds. What is your average speed?
80 n/s
2 m/s
1 m/s
0.5 m/s

What is the average speed for the first section of the graph?
0 km/h
30 km/h
15 km/h
-15 km/h

What is the speed of a man who runs 10 miles in 1 hr?
20 miles
10 m/min
10 miles/hr
20 hrs


A car travels 30 miles/hr for 3 hours, calculate the distance it will travel
90 miles
10 miles
600 miles
90 km
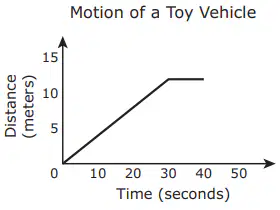
A student investigates the motion of a toy vehicle. The student graphs 40 seconds of data from the investigation.
Which statement best describes the motion of the toy vehicle during the first 30 seconds of the investigation?
The vehicle was traveling at a constant speed.
The vehicle was accelerating at a constant rate.
The speed of the vehicle was increasing.
The acceleration of the vehicle was increasing.
What is the difference between the velocity and the speed of an object?
Velocity is the change in distance over time, while speed is the change in velocity over time.
Velocity has a direction associated with it, while speed has no specific direction.
Velocity has no direction associated with it, while speed has a specific direction.
Velocity is the change in speed over time, while speed is the change in distance over time.
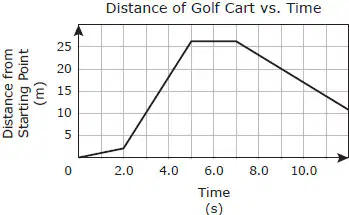
A golfer collected data on the distance a golf cart traveled in a straight line and plotted it on a graph.
Which of these does NOT describe the cart’s motion on this graph?
The cart moved 24 m away from the starting point between 2 s and 5 s.
The cart moved toward the starting point at a speed of 3 m/s between 7 s and 12 s.
The cart moved 11 m toward the starting point between 8 s and 10 s.
The cart moved away from the starting point at a speed of 1 m/s for 2 s.
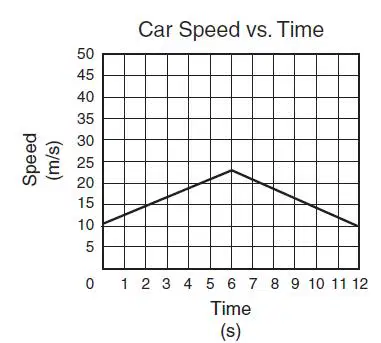
The graph shows the speed of a car traveling east over a 12-second period on a flat surface. In the first 6 seconds shown on the graph, the car is —
increasing its speed
changing direction
heading northeast
gaining potential energy
A bus travels 20 km in 30 minutes. What is the average speed of the bus?
20 km/h
30 km/h
40 km/h
50 km/h

A school bus is stopped to allow children to get off of the bus. Which of the graphs shows the motion of the bus?
A
B
C
D

