
 Worksheets
2nd SW Review Quizizz
Total questions: 50
Worksheet time: 4hrs 10mins
Which equation represents the line that passes through the point (5, 2) and has a slope of 4?
HINT: Make sure to use the point-slope formula y−y1=m(x−x1)
y−5=4(x−2)
y+2=4(x+5)
y−2=4(x−5)
y+5=4(x+2)
Which equation represents the line that passes through the point (2, 7) and has a slope of 4?
HINT: Make sure to use the point-slope formula y−y1=m(x−x1)
y+2=4(x+7)
y−2=4(x−7)
y+7=4(x+2)
y−7=4(x−2)
Which equation represents the line that passes through the point (1, 6) and has a slope of 3?
HINT: Make sure to use the point-slope formula y−y1=m(x−x1)
y−6=3(x−1)
y−1=3(x−6)
y+6=3(x+1)
y−3=1(x−3)
Which equation represents the line that passes through the point (-2, -1) and has a slope of -3?
HINT: Make sure to use the point-slope formula y−y1=m(x−x1)
y+1=−3(x−2)
y+1=−3(x+2)
y−1=3(x−1)
y+2=−3(x+1)
Which equation represents the line that passes through the point (2, 4) and has a slope of 5?
HINT: Make sure to use the point-slope formula y−y1=m(x−x1)
y−2=5(x−4)
y−4=5(x−2)
y−5=4(x−2)
y−2=4(x−5)
Which equation represents the line that passes through the point (1, 7) and has a slope of 3?
HINT: Make sure to use the point-slope formula y−y1=m(x−x1)
y−7=3(x−1)
y−1=3(x−7)
y−3=3(x−1)
y−1=7(x−3)
Which equation represents the line that passes through the point (9, -6) and has a slope of 2?
HINT: Make sure to use the point-slope formula y−y1=m(x−x1)
y+6=2(x−9)
y−6=2(x+9)
y−6=2(x−9)
y+6=2(x+9)
Which equation represents the line that passes through the point (6, 1) and has a slope of -3?
HINT: Make sure to use the point-slope formula y−y1=m(x−x1)
y−6=−3(x−1)
y+6=−3(x+1)
y−1=−3(x−6)
y+1=−3(x+3)
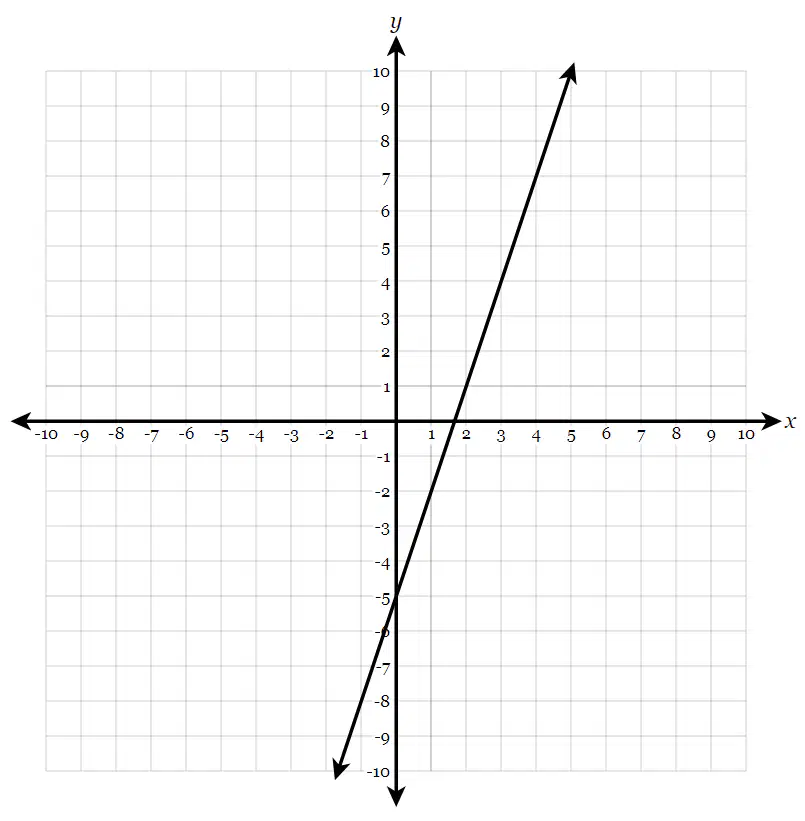
Which equation describes the line that passes through the point (0, 10) and is parallel to the line represented in the graph?
HINT: Find the m (slope) by finding the runrise from the graph. Then use the slope-intercept formula y=mx+b. Plug in the point and the slope and use MENU 31 to find b. Then use y=mx+b one more time but only plug in the m and b.
y=3x+10
y=3−1x+10
y=3−1x−10
y=3x−30
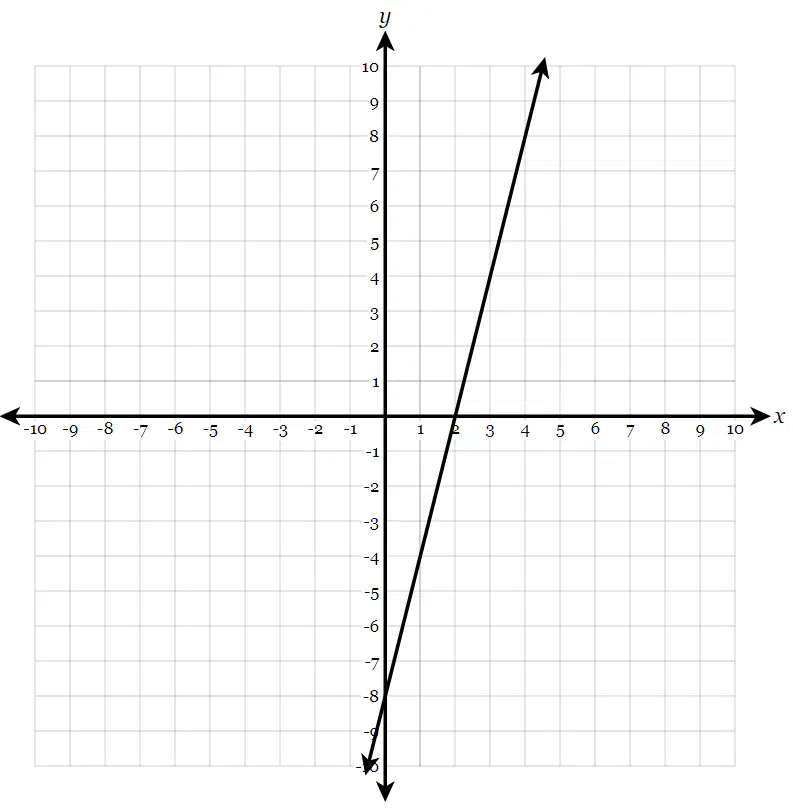
Which equation describes the line that passes through the point (0, 7) and is parallel to the line represented in the graph?
HINT: Find the m (slope) by finding the runrise from the graph. Then use the slope-intercept formula y=mx+b. Plug in the point and the slope and use MENU 31 to find b. Then use y=mx+b one more time but only plug in the m and b.
y=4x−28
y=4x+7
y=4−1x+7
y=4−1x+47
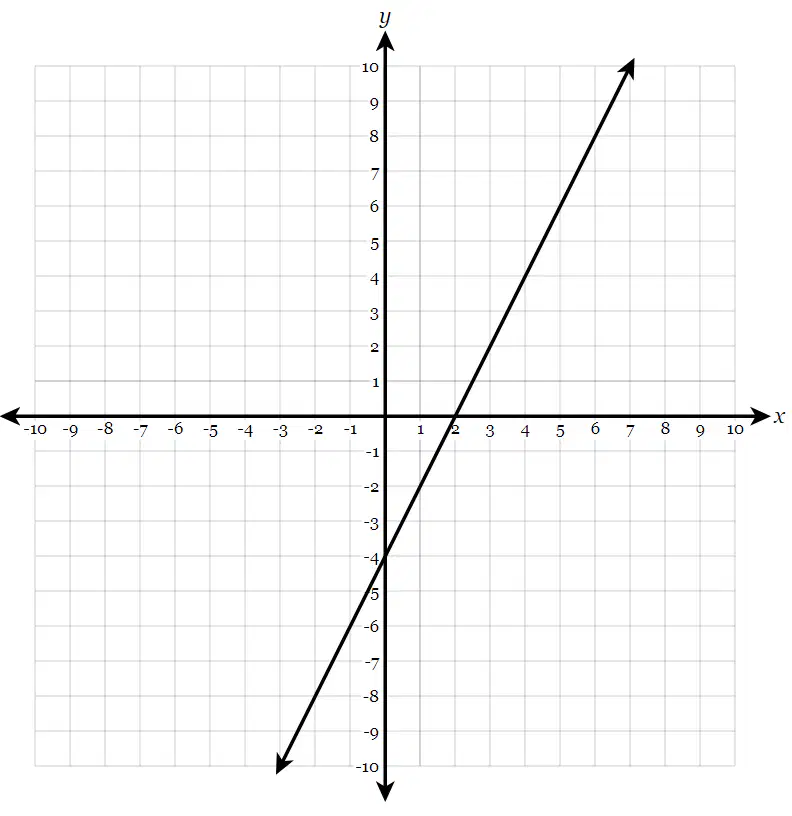
Which equation describes the line that passes through the point (2, 6) and is parallel to the line represented in the graph?
HINT: Find the m (slope) by finding the runrise from the graph. Then use the slope-intercept formula y=mx+b. Plug in the point and the slope and use MENU 31 to find b. Then use y=mx+b one more time but only plug in the m and b.
y=2x+2
y=2x+4
y=2−1x+7
y=2−1x+4

Which equation describes the line that passes through the point (-1, 4) and is parallel to the line represented in the graph?
HINT: Find the m (slope) by finding the runrise from the graph. Then use the slope-intercept formula y=mx+b. Plug in the point and the slope and use MENU 31 to find b. Then use y=mx+b one more time but only plug in the m and b.
y=3x+7
y=3x+5
y=3x−13
y=3x−5

Which equation describes the line that passes through the point (0, 6) and is parallel to the line represented in the graph?
HINT: Find the m (slope) by finding the runrise from the graph. Then use the slope-intercept formula y=mx+b. Plug in the point and the slope and use MENU 31 to find b. Then use y=mx+b one more time but only plug in the m and b.
y=4x+6
y=4x−6
y=4x−24
y=4x+24

Which equation describes the line that passes through the point (0, 10) and is parallel to the line represented in the graph?
HINT: Find the m (slope) by finding the runrise from the graph. Then use the slope-intercept formula y=mx+b. Plug in the point and the slope and use MENU 31 to find b. Then use y=mx+b one more time but only plug in the m and b.
y=5x+10
y=5x−10
y=5x−50
y=5x+50
What is the equation in slope-intercept form of the line that passes through the point (3, −2) and is perpendicular to the line represented by y=53x+2 ?
HINT: Don't forget because it says PERPENDICULAR to FLIP and CHANGE the slope. Then use the slope-intercept formula y=mx+b. Plug in the point and the slope and use MENU 31 to find b. Then use y=mx+b one more time but only plug in the m and b.
y=3−5x+3
y=3−5x−5
y=35x+3
y=35x−5
What is the equation in slope-intercept form of the line that passes through the point (4, −4) and is perpendicular to the line represented by y=34x−2 ?
HINT: Don't forget because it says PERPENDICULAR to FLIP and CHANGE the slope. Then use the slope-intercept formula y=mx+b. Plug in the point and the slope and use MENU 31 to find b. Then use y=mx+b one more time but only plug in the m and b.
y=4−3x−1
y=43x−1
y=4−3x+7
y=43x+7
What is the equation in slope-intercept form of the line that passes through the point (3,−3) and is perpendicular to the line represented by y=43x+5 ?
HINT: Don't forget because it says PERPENDICULAR to FLIP and CHANGE the slope. Then use the slope-intercept formula y=mx+b. Plug in the point and the slope and use MENU 31 to find b. Then use y=mx+b one more time but only plug in the m and b.
y=3−4x−1
y=3−4x+1
y=3−4x−6
y=3−4x+6
What is the equation in slope-intercept form of the line that passes through the point (5,−4) and is perpendicular to the line represented by y=25x+3 ?
HINT: Don't forget because it says PERPENDICULAR to FLIP and CHANGE the slope. Then use the slope-intercept formula y=mx+b. Plug in the point and the slope and use MENU 31 to find b. Then use y=mx+b one more time but only plug in the m and b.
y=5−2x+2
y=5−2x−2
y=5−2x+9
y=5−2x−9
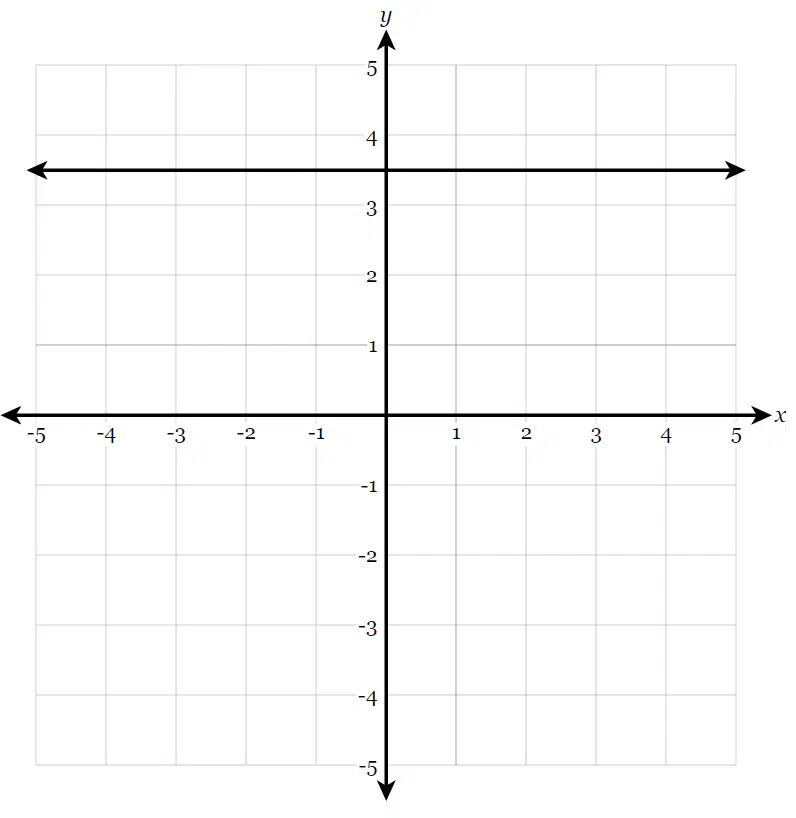
Which statement best represents the equation of the line shown on the grid and its relationship to the x-axis?
HINT: Remember to use HOY:
Horizontal lines
zeroO slopes
Y=# it crosses
The equation of the line is x = 3.5, and the line is parallel to the x-axis.
The equation of the line is x = 3.5, and the line is perpendicular to the x-axis.
The equation of the line is y = 3.5, and the line is parallel to the x-axis.
The equation of the line is y = 3.5, and the line is perpendicular to the x-axis.

Which statement best represents the equation of the line shown on the grid and its relationship to the x-axis?
HINT: Remember to use HOY:
Horizontal lines
zeroO slopes
Y=# it crosses
The equation of the line is x = -1.5, and the line is parallel to the x-axis.
The equation of the line is y = -1.5, and the line is parallel to the x-axis.
The equation of the line is x = -1.5, and the line is perpendicular to the x-axis.
The equation of the line is y = -1.5, and the line is perpendicular to the x-axis.
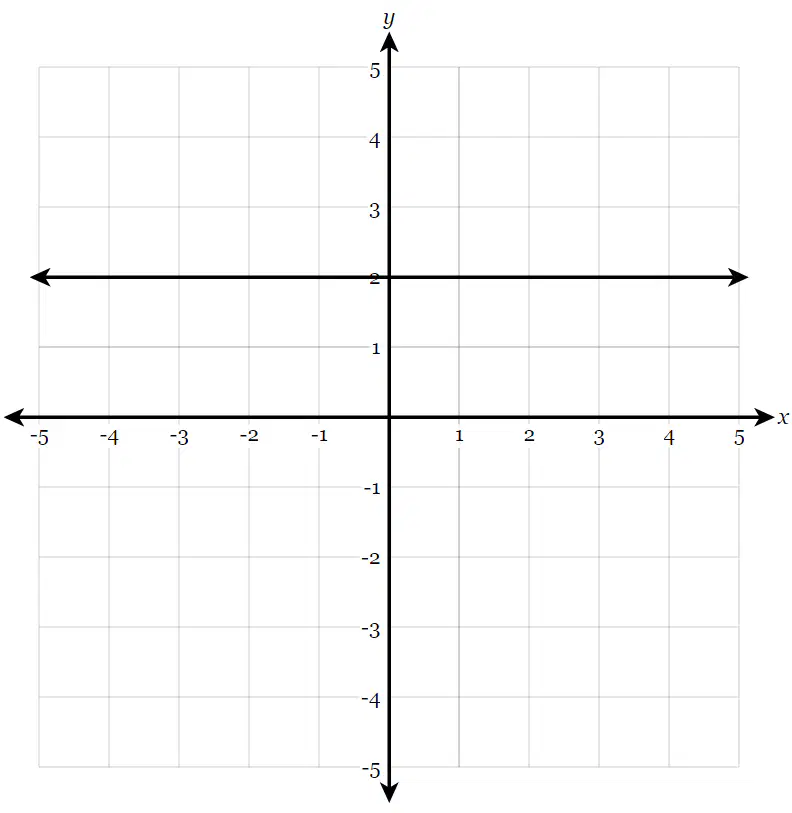
Which statement best represents the equation of the line shown on the grid and its relationship to the x-axis?
HINT: Remember to use HOY:
Horizontal lines
zeroO slopes
Y=# it crosses
The equation of the line is x = 2, and the line is parallel to the x-axis.
The equation of the line is x = 2, and the line is perpendicular to the x-axis.
The equation of the line is y = 2, and the line is parallel to the x-axis.
The equation of the line is y = 2, and the line is perpendicular to the x-axis.
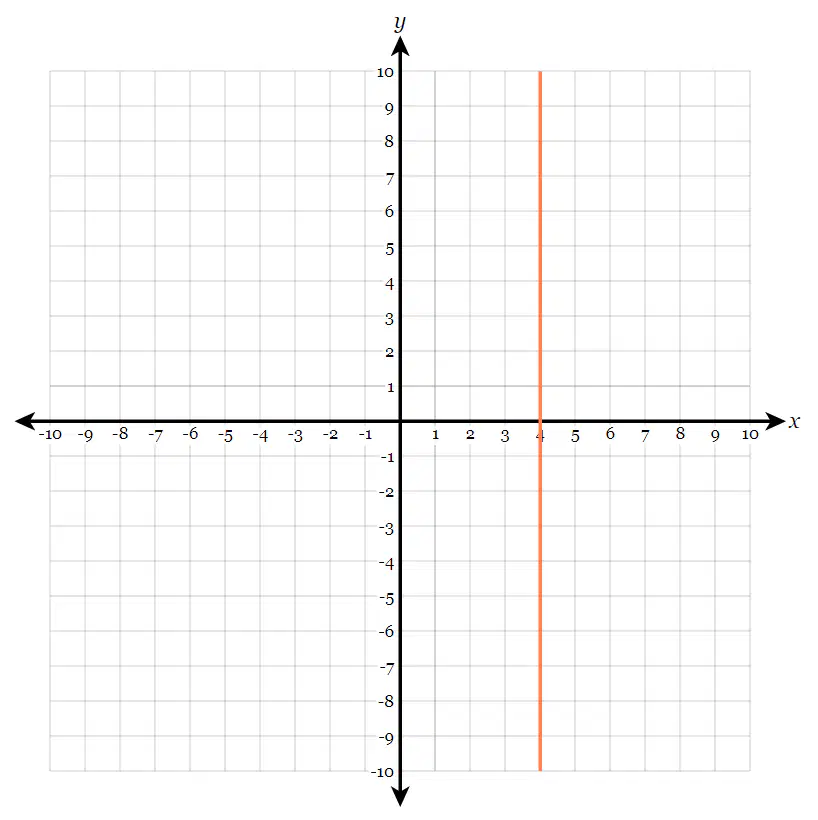
What are the equation and slope of the line shown on the grid?
HINT: Remember to use VUX:
Vertical lines
Undefined slopes
X=# it crosses
x=4; slope is zero
y=4; slope is 4
x=4; slope is undefined
y=4; slope is −1/4
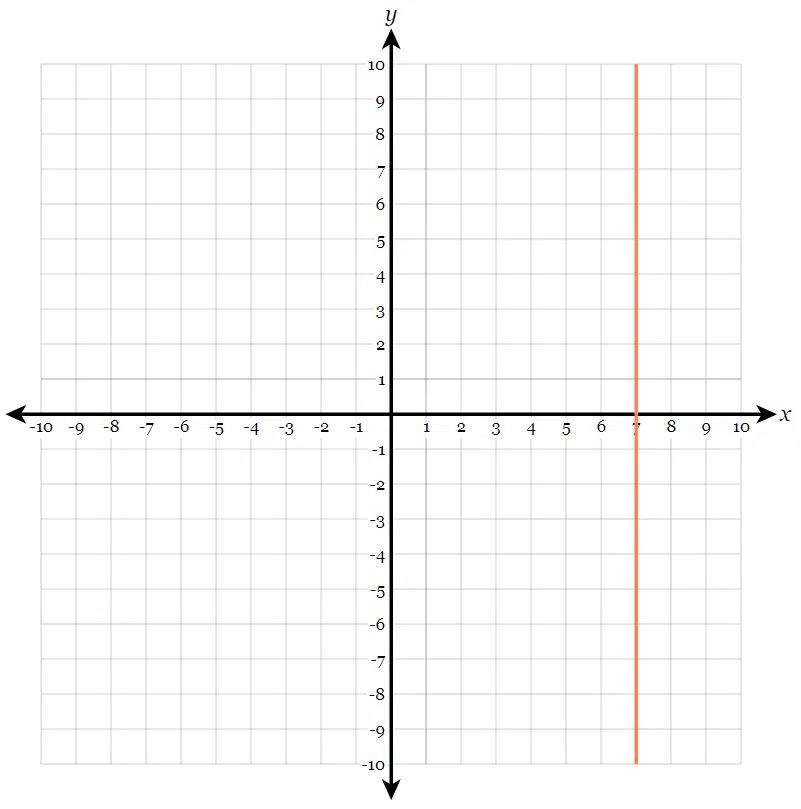
What are the equation and slope of the line shown on the grid?
HINT: Remember to use VUX:
Vertical lines
Undefined slopes
X=# it crosses
x=7; slope is zero
y=7; slope is 7
x=7; slope is undefined
y=7; slope is −1/7
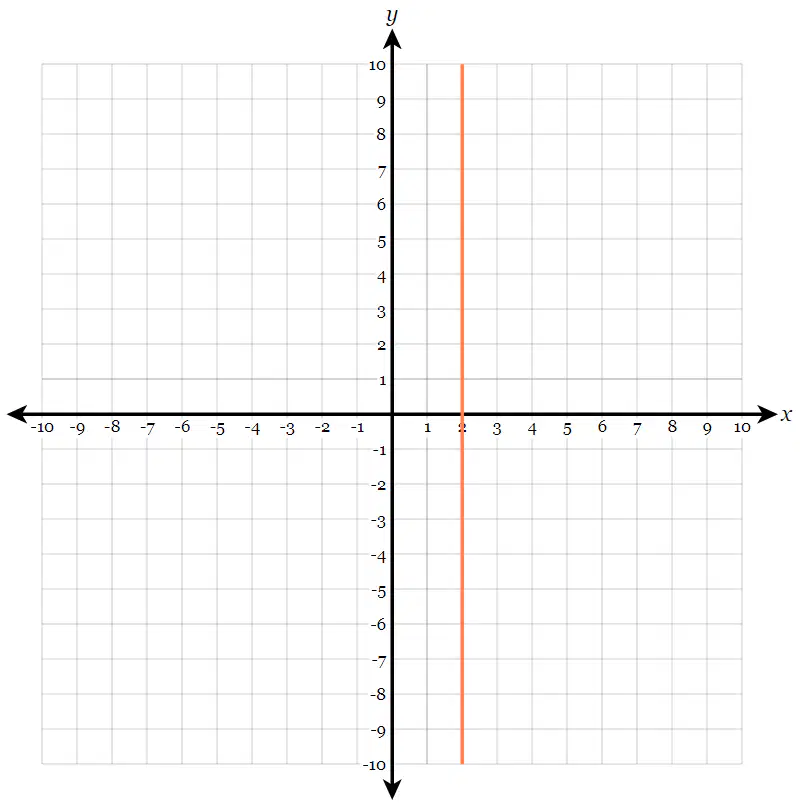
What are the equation and slope of the line shown on the grid?
HINT: Remember to use VUX:
Vertical lines
Undefined slopes
X=# it crosses
x=2; slope is zero
y=2; slope is 2
x=2; slope is undefined
y=2; slope is −1/2
An elementary school is going to send students on four field trips during the school year. The number of buses needed to transport the students is a function of the number of students who went on each trip. This function consists of only the ordered pairs (30, 2), (49, 3), (77, 4), and (136, 6). What is the domain for this situation?
HINT: Domain is the x-values, if they give you ordered pairs make sure to label ordered pairs as (x, y).
{30, 49, 77, 136}
{2, 3, 4, 6}
{30, 136}
{2, 3, 4, 6, 30, 49, 77, 136}
A middle school is going to have students participate in four volunteer activities. The number of buses needed to transport the students is a function of the number of students who went on the volunteer trip. This function consists of only the ordered pairs (24, 1), (56, 2), (88, 4), and (112, 5). What is the domain for this situation?
HINT: Domain is the x-values, if they give you ordered pairs make sure to label ordered pairs as (x, y).
{24, 56, 88, 112}
{1, 2, 4, 5}
{24, 112}
{1, 2, 4, 5, 24, 56, 88, 112}
A high school is going to have students apply to four different scholarship opportunities. The number of students apply to the scholarship opportunities is a function of the number of students who received the scholarship. This function consists of only the ordered pairs (30, 3), (49, 5), (120, 12), and (210, 21). What is the domain for this situation?
HINT: Domain is the x-values, if they give you ordered pairs make sure to label ordered pairs as (x, y).
{30, 49, 120, 210}
{3, 5, 12, 21}
{30, 210}
{3, 5, 12, 21, 30, 49, 120, 210}
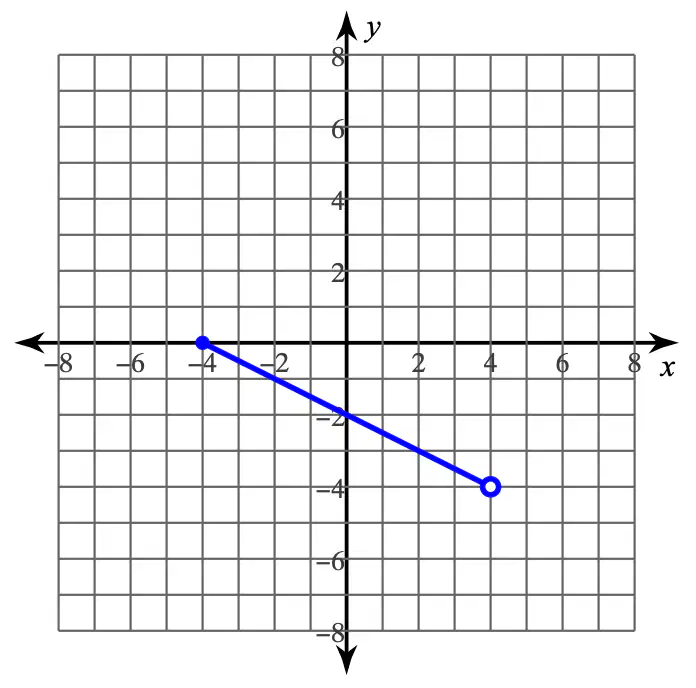
Function f is graphed. What is the range of f ?
HINT: Range is the y-values. Range is when you scan from BOTTOM to TOP. Also, OPEN DOT is the < symbol and CLOSED DOT is ≤ symbol.
{x ∣ −4≤x<4}
{x ∣ −4<x≤4}
{y ∣ −4<y≤0}
{y ∣ −4≤y<0}
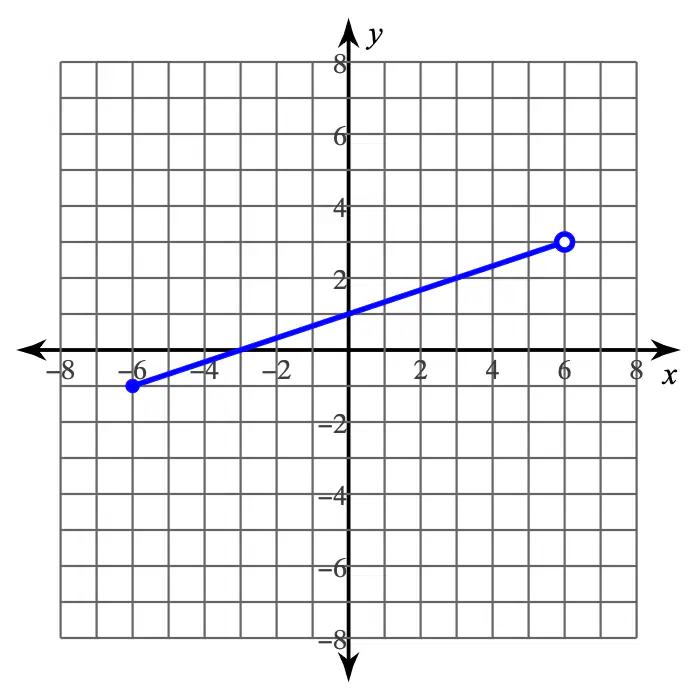
Function f is graphed. What is the range of f ?
HINT: Range is the y-values. Range is when you scan from BOTTOM to TOP. Also, OPEN DOT is the < symbol and CLOSED DOT is ≤ symbol.
{x ∣ −6≤x<6}
{x ∣ −6<x≤6}
{y ∣ −1<y≤3}
{y ∣ −1≤y<3}
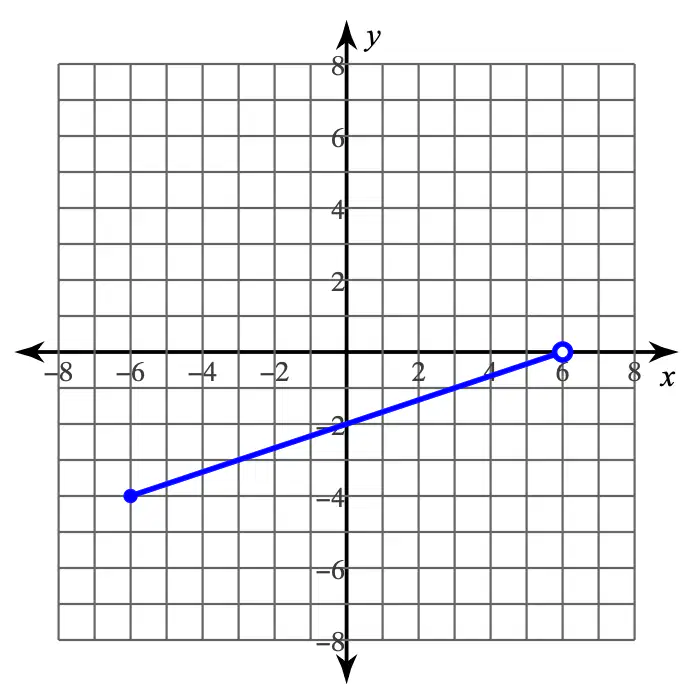
Function f is graphed. What is the range of f ?
HINT: Range is the y-values. Range is when you scan from BOTTOM to TOP. Also, OPEN DOT is the < symbol and CLOSED DOT is ≤ symbol.
{x ∣ −6≤x<6}
{x ∣ −6<x≤6}
{y ∣ −4≤y<0}
{y ∣ −4<y≤0}
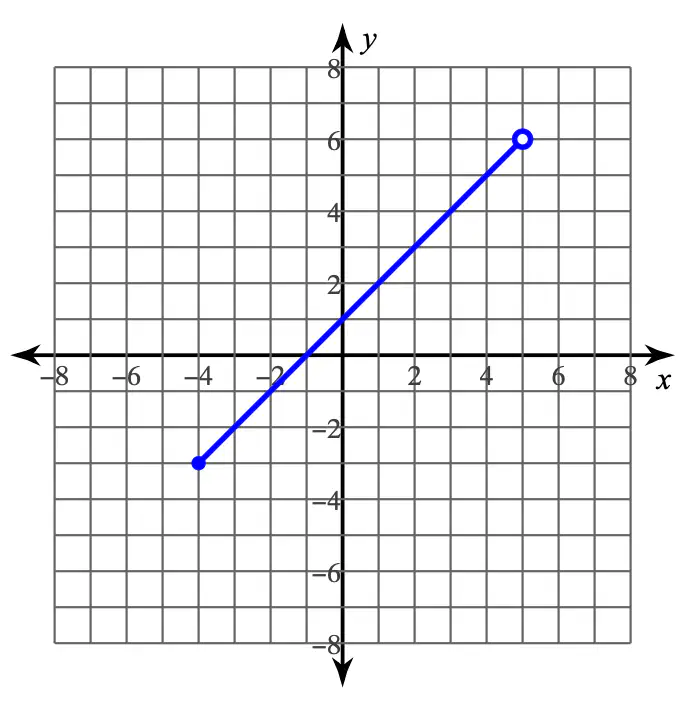
Function f is graphed. What is the range of f ?
HINT: Range is the y-values. Range is when you scan from BOTTOM to TOP. Also, OPEN DOT is the < symbol and CLOSED DOT is ≤ symbol.
{x ∣ −4≤x<5}
{x ∣ −4<x≤5}
{y ∣ −3≤y<6}
{y ∣ −3<y≤6}

Function f is graphed. What is the range of f ?
HINT: Range is the y-values. Range is when you scan from BOTTOM to TOP. Also, OPEN DOT is the < symbol and CLOSED DOT is ≤ symbol.
{x ∣ −6<x≤6}
{x ∣ −6≤x<6}
{y ∣ −5<y≤1}
{y ∣ −5≤y<1}
Given f(x) = 5(2 - x), what is the value of f(-5)?
HINT: Replace the x with the given value of (-5).
Given f(x) = 4(10 - x), what is the value of f(3)?
HINT: Replace the x with the given value of (3).
Given f(x) = 5(2 - x), what is the value of f(-10)?
HINT: Replace the x with the given value of (-10).
Given f(x) = 2(4 - x), what is the value of f(-4)?
HINT: Replace the x with the given value of (-4).
Given f(x) = 4(5 - x), what is the value of f(-3)?
HINT: Replace the x with the given value of (-3).
The value of y is directly proportional to the value of x. When x = 25, y = 125. What is the value of y when x = 31?
HINT: Create a PROPORTION (RKW), then use MENU 31.
155
100
7
6.2
The value of y is directly proportional to the value of x. When x = 6, y = 30. What is the value of y when x = 100?
HINT: Create a PROPORTION (RKW), then use MENU 31.
18
20
80
500
The value of y is directly proportional to the value of x. When x = 9, y = 54. What is the value of y when x = 15?
HINT: Create a PROPORTION (RKW), then use MENU 31.
81
2.5
32.4
90
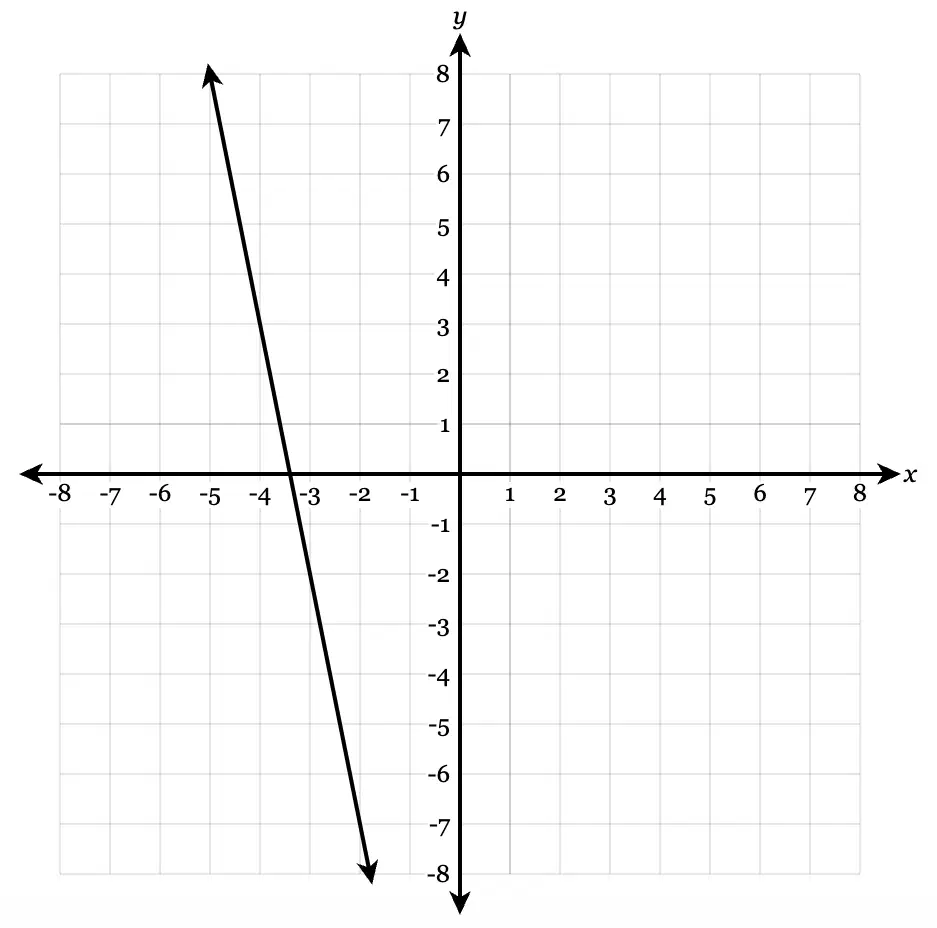
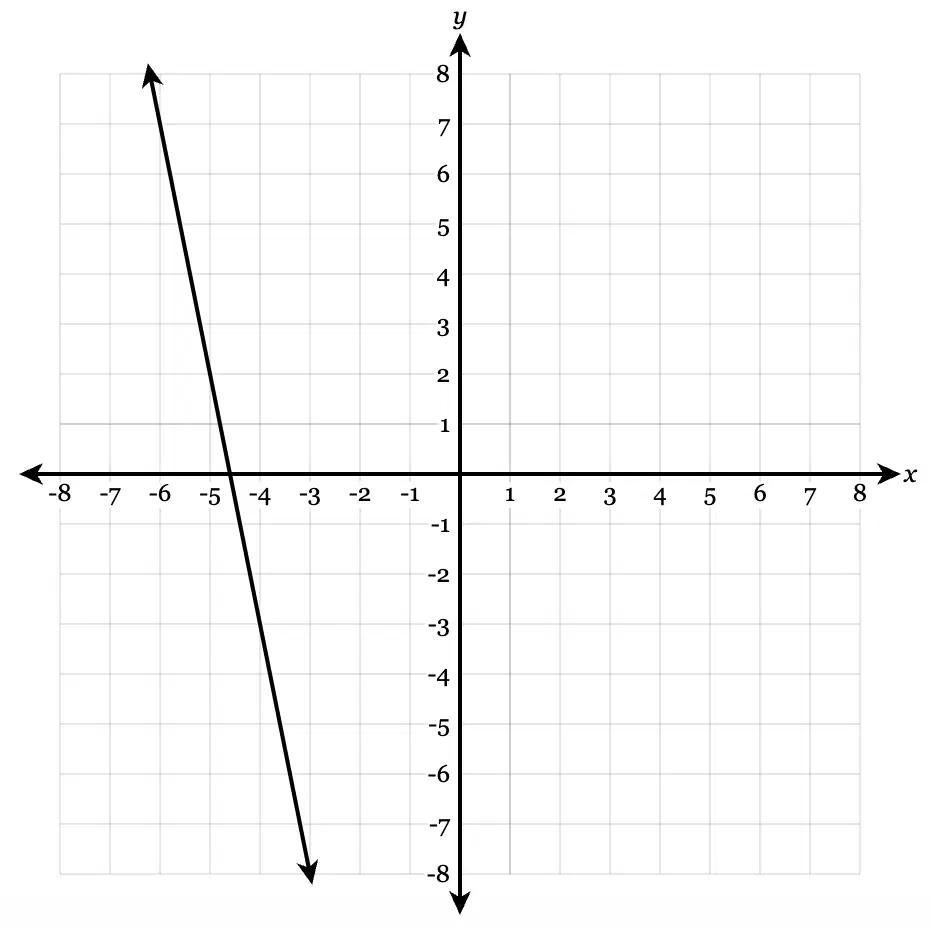
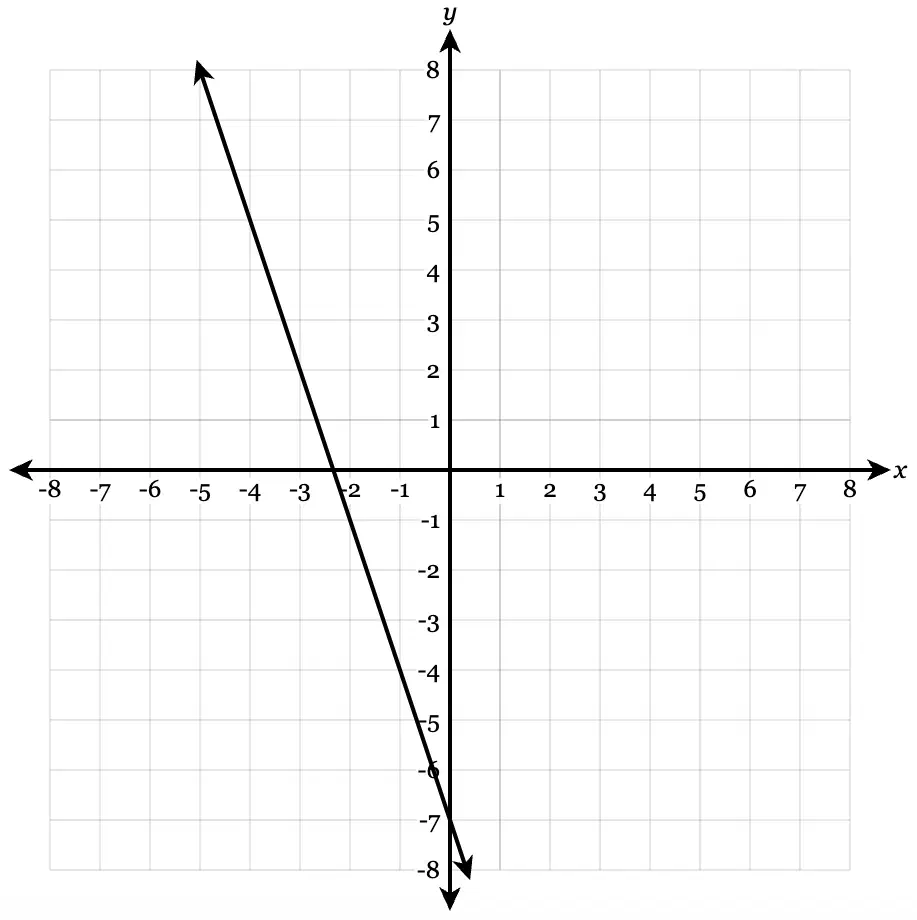
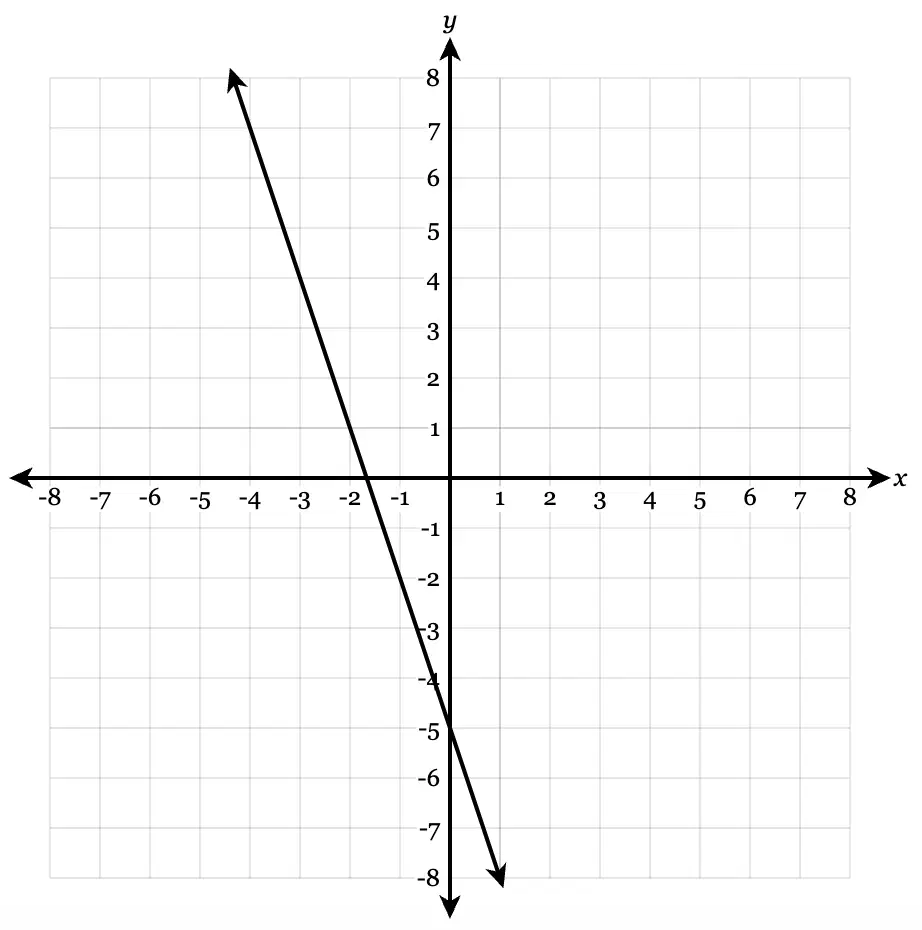
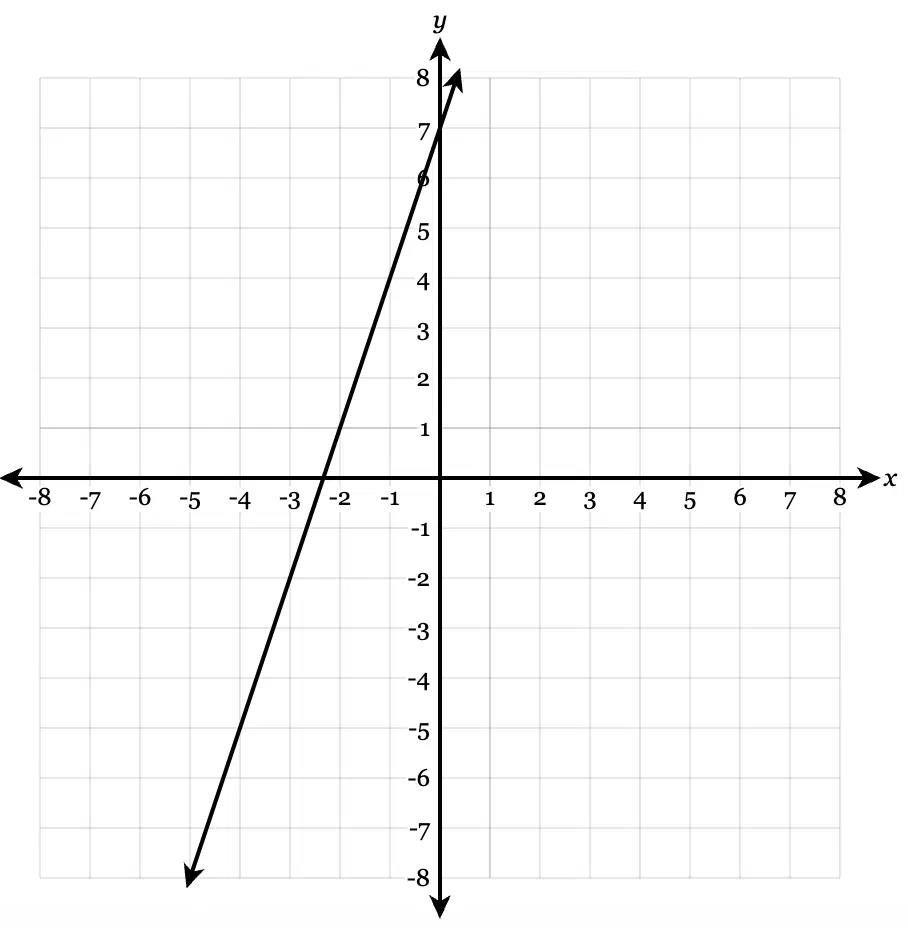
Which graph best represents y=−5(x+4)+3 ?
HINT: On your calculator make a New Document, Add a Graph, and Graph the given equation and check which answer choice matches exactly. Make sure to verify a specific point such as the x-intercept.


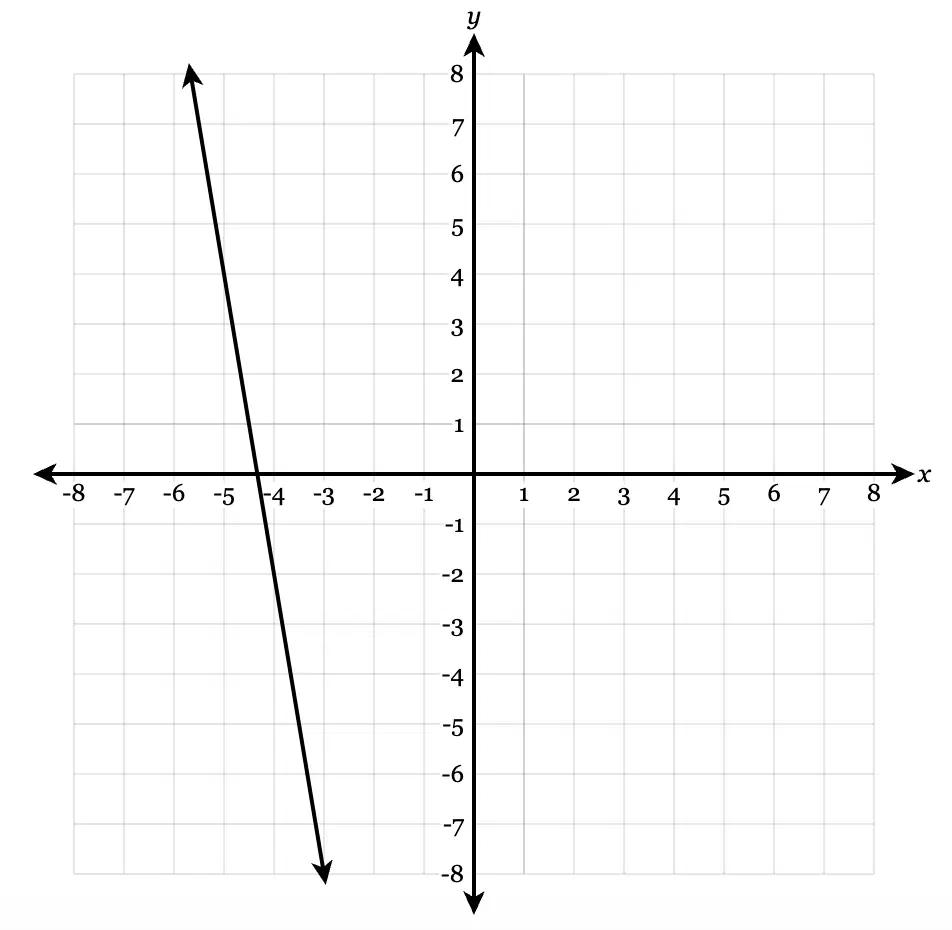
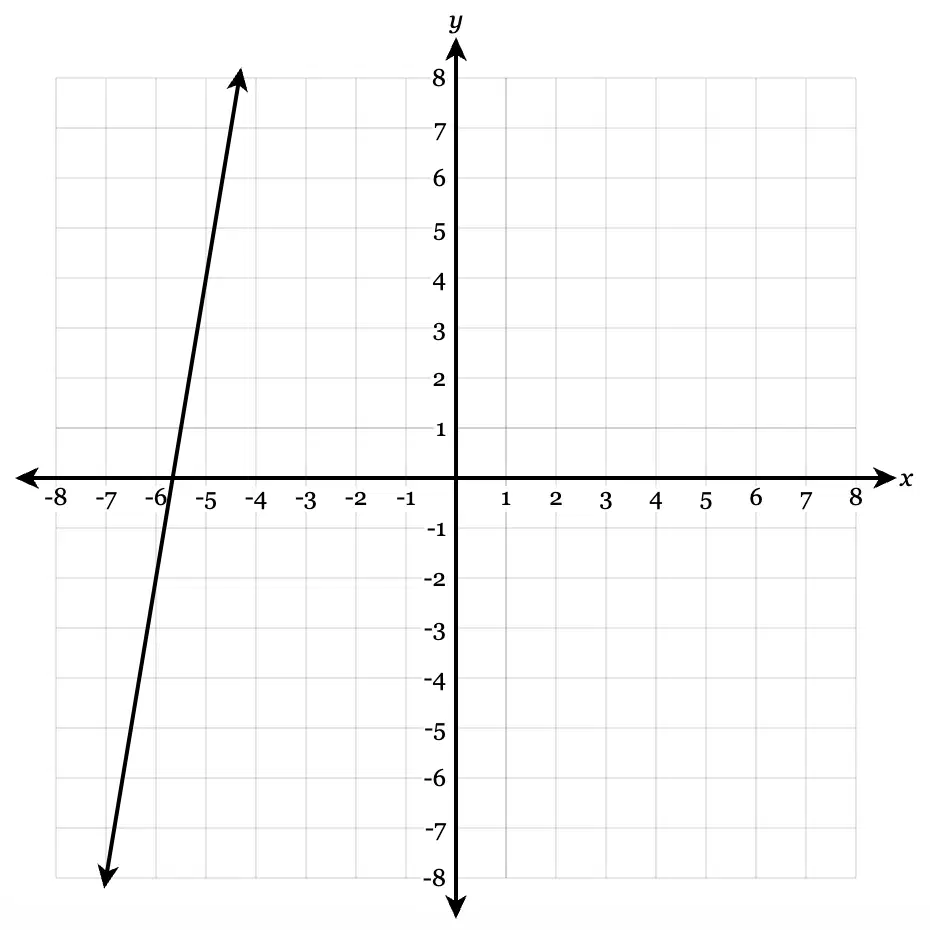
Which graph best represents y=−6(x+5)−4 ?
HINT: On your calculator make a New Document, Add a Graph, and Graph the given equation and check which answer choice matches exactly. Make sure to verify a specific point such as the x-intercept.


Which graph best represents y=−3(x+2)−1 ?
HINT: On your calculator make a New Document, Add a Graph, and Graph the given equation and check which answer choice matches exactly. Make sure to verify a specific point such as the x-intercept.

The graph of a line passes through the points (−4, 2) and (6, 9).
What is the slope of the line?
HINT: Use the slope formula m=x2−x1y2−y1
107
10−7
27
2−7
The graph of a line passes through the points (−2, 0) and (4, 7).
What is the slope of the line?
HINT: Use the slope formula m=x2−x1y2−y1
67
6−7
27
2−7
The graph of a line passes through the points (−3, 4) and (5, 10).
What is the slope of the line?
HINT: Use the slope formula m=x2−x1y2−y1
43
4−3
3
−3
The graph of a line passes through the points (−5, 4) and (7, 9).
What is the slope of the line?
HINT: Use the slope formula m=x2−x1y2−y1
125
12−5
25
2−5

A restaurant sells pizza for the prices in the data table. Which function best models the data?
HINT: This is 8th grade math, on your calculator: Press Home, Make a New Document, Add Lists & Spreadsheet, Label the first column as x and the second column as y, enter all data that is provided in the problem, then press Home, Add Data & Statistics (Purple Page), Label the X and Y axis, then Press Menu 461. This will create the equation that best fits the data.
y=1.5x+12
y=12x+1.5
y=0.67x−8
y=−8x+0.67

A person is traveling by car from the valley through the state of Texas. They record their miles driven in a data table. Which function best models the data?
HINT: This is 8th grade math, on your calculator: Press Home, Make a New Document, Add Lists & Spreadsheet, Label the first column as x and the second column as y, enter all data that is provided in the problem, then press Home, Add Data & Statistics (Purple Page), Label the X and Y axis, then Press Menu 461. This will create the equation that best fits the data.
y=61.93x−1.79
y=−1.79x+61.93
y=0.016x+0.03
y=0.03x+0.016
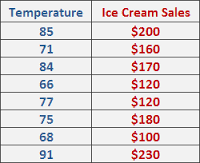
An ice cream store is conducting a study to find a relationship between the outdoor temperature and the amount of money they earn from ice cream sales. Which function best models the data?
HINT: This is 8th grade math, on your calculator: Press Home, Make a New Document, Add Lists & Spreadsheet, Label the first column as x and the second column as y, enter all data that is provided in the problem, then press Home, Add Data & Statistics (Purple Page), Label the X and Y axis, then Press Menu 461. This will create the equation that best fits the data.
y=163.41x+1.49
y=−163.41x+4.19
y=−4.19x+163.41
y=4.19x−163.41

