
 Worksheets
AP Stats - Part 2 MCQ Practice
Total questions: 10
Worksheet time: 32mins
A nutritionist has found that there is the following linear relationship between exercise (measured in hours) and fat loss (measured in pounds):
Predicted Fat loss = -0.721(Exercise time) + 0.019
Which of the following is the correct interpretation of the relationship between the two variables?
The relationship between the variables is positive because the value of the intercept is positive.
There is likely no relationship between the variables because the value of the intercept is so small.
The relationship between the variables is negative because of the negative value of the slope.
There is certainly no relationship between the variables because the slope is negative while the intercept is positive.
There is likely no relationship between the variables because the value of the slope is smaller than 1.

Why does Chart 1 show a better fitting line than Chart 2?
Because it has a negative correlation.
Because it shows a positive correlation
Because it shows proof of causality
Because it has a lower value of the sum of squares
Because the value of the slope is negative

Why does the dataset in the image most likely have a correlation of roughly 0.5?
Because the two datasets move in opposite directions
Because there is no connection between the datasets
Because, at certain times, the increase in the value of one dataset is associated with the increase of the value of the second dataset
Because, at ceratin times, as the value of one dataset increases, the other significantly decreases
Because it is clear that the change in one variable causes a change in the other variable.

In the residual plot in the image, is the particular point indicated an overestimate, underestimate, or neither? Why?

Overestimate, because

Underestimate, because
Neither

Underestimate, because

Overestimate, because

In the scatter plot, what effect does the indicated point have on the correlation coefficient and the slope of the least-squares regression line?
The point is influential; r decreases and the slope increases.
The point is influential; r decreases and the slope decreases.
The point is influential; r decreases and the slope in unaffected.
The point is NOT influential; therefore, r and the slope are unaffected.
The point is influential; therefore, r and the slope are unaffected.

In the scatterplot, how could the data be transformed in order to do a linear regression?
By squaring each data point's y-value
By taking the natural logarithm of each data point's y-value
By raising each data point's y-value to the base 10
By taking the square root of each data point's y-value
By cubing each data point's y-value
Which type of variation does r2 pertain to?
Total variation
Unexplained variation
Explained variation
Least squares variation
Error variation
A researcher has decided to standardize her datasets for GDP and the number of people that are unemployed by calculating percentages. Why has she most likely done so?
To decrease the left skew of the datasets
To make the dataset more convenient to work with by adjusting for different levels and spread
To prepare the dataset for a log transformation that will remove any chance that the data is nonstationary
To prepare the dataset for cube root transformation
To decrease the right skew of the datasets
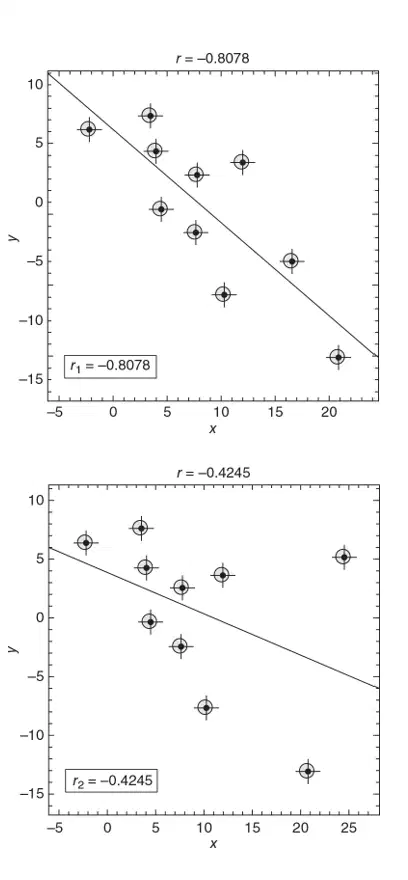
Compare the two scatterplots in the image. Which of the following statements is true about r .
r1 indicated a highly negative correlation, while r2 indicated a moderate positive correlation.
The r value shows that there is causation between the datasets.
r2 indicates a stronger correlation than r1 .
r can be used to find the percentage of variation that has been explained.
The r value in this example is sensitive to outliers.
Suppose that both height and weight of adult men can be described with Normal models, and that the correlation between these variables is 0.65. If a man’s height places him at the 60th percentile, at what percentile would you expect his weight to be?
Round your answer to the nearest hundredth. You should only answer with the percentile, no words (numeric).
(a)

