Wayground logo

Free Printable Worksheets

Font size

S
M
L
XL
Worksheets

Topic 8 Summative Review

Total questions: 166

Worksheet time: 42hrs 30mins

Name
Class
Date
1.

What is the range?

a)

The sum of the largest and smallest number

b)

The number in the middle

c)

The difference between the largest and smallest number

d)

The number that appears most often

2.

What is the median?

a)

The number in the middle when the numbers are in order from least to greatest.

b)

The difference between the largest and smallest number.

c)

The average

d)

The number that appears most often.

3.
What is the mode?
a)
The average
b)
The number that appears most often.
c)
The largest number - the smallest number
d)
The number in the middle.
4.
To find the average of a set of numbers, add up all the items and divide by...
a)
2.
b)
The smallest number
c)
The largest number
d)
The number of items in the set.
5.
A data set can have more than one mode
a)
True
b)
False
6.
When you are trying to find the MEDIAN of a set of data and 2 numbers are left in the middle after putting them in order from least to greatest, what do you do?
a)
List both of the numbers as the Median.
b)
Add the two numbers together and divide by 2.
c)
Pick the one that you want.
d)
Subtract the two numbers.
7.
Roger bowled 7 games last weekend. His scores are: 155, 165, 138, 172, 127, 193, 142. What is the range of Roger's scores?
a)
193
b)
127
c)
60
d)
66
8.
The mode score on the 6th grade math test was 94! Which of these interpretations must be correct?
a)
99 was the highest score on the test.
b)
More students received a 94 than any other score
c)
No student scored below a 50
d)
A score of 91 was slightly below average.
9.

The number of miles that Jenna cycled each week for a 7-week period is shown:

36, 42, 28, 52, 48, 36, 31

What is the median number of miles Jenna cycled?

a)

24

b)

39

c)

36

d)

52

10.
In order to find the median, the data must be sorted from least to greatest first.
a)
True
b)
False
11.

Dr. Dre is a dentist. He needs to report on the average (Mean) number of cavities that his patients have.

1, 0, 1, 5, 0, 3, 4. What is the average number of cavities?

a)

14

b)

2

c)

7

d)

1

12.

At Donald's Donuts the number of donut holes in a bag can vary. Help Donald find the MODE.

12,10,10,10,13,12,11,13,10

a)

10

b)

12

c)

10 and 12

d)

No Mode

13.

The heights of some students are given.

158cm 172cm 164cm

164cm 167cm 159cm

What is the RANGE of the heights?

a)

13 cm

b)

330 cm

c)

164 cm

d)

14 cm

14.

What is the MEDIAN of this set of data?

10, 90, 80, 60, 50, 40, 70, 30, 20, 100

a)

50

b)

60

c)

55

d)

45

15.
What is the mode?
a)
# happening the most
b)
the average
c)
biggest - smallest
d)
the middle #
16.
What is the mean?
a)
# happening the most
b)
the number in the middle
c)
biggest-smallest
d)
the average
17.
A data set can have more than one median?
a)
True
b)
False
18.
The number of pages that Carolyn wrote in her journal each day from Monday to Friday is shown below: 
9, 8, 12, 6, 10
What is the mean number of pages she wrote per day?
a)
5
b)
6
c)
9
d)
11
19.
The number of miles that Jenna cycled each week for a 7-week period is shown: 
36, 42, 28, 52, 48, 36, 31 
What is the median number of miles Jenna cycled?
a)
24
b)
36
c)
39
d)
52
20.
Find the range.
5, 15, 10, 20, 15, 10, 15
a)
5
b)
10
c)
15
d)
13
21.
Mode:
67, 74, 95, 98, 98, 99, 102
a)
90.4
b)
35
c)
92
d)
98
22.
Find the median of these numbers:
4,2,7,4,3
a)
2
b)
5
c)
7
d)
4
23.
A data set can have more than one mode
a)
True
b)
False
24.
To find the average of a set of numbers, add up all the items and divide by...
a)
2
b)
The minimum
c)
The maximum
d)
The number of items
25.
What is the definition of the range?
a)
The average
b)
The number that occurs the most
c)
The middle number
d)
The difference of the largest and smallest numbers
26.

Ervin bowled 7 games last weekend. His scores are: 155, 165, 138, 172, 127, 193, 142. What is the range of Ervin's scores?

a)

193

b)

127

c)

60

d)

66

27.

The scores awarded to 25 students for an assignment were as follows:

4 7 5 9 8 6 7 7 8 5 6 9 8 5 8 7 4 7 3 6 8 9 7 6 9

What is the mode?

a)

6

b)

7

c)

8

d)

9

28.
Find the median of these numbers:
4,2,7,4,3
a)
2
b)
5
c)
7
d)
4
29.
In order to find the median, the data must be sorted from least to greatest first.
a)
True
b)
False
30.
What is the range?
a)
average
b)
biggest-smallest
c)
the middle #
d)
# happening the most
31.
What is the mean?
a)
# happening the most
b)
the number in the middle
c)
biggest-smallest
d)
the average
32.
What is the median?
a)
biggest- smallest
b)
average
c)
the middle #
d)
# that happens the most
33.
What is the mode?
a)
# happening the most
b)
the average
c)
biggest - smallest
d)
the middle #
34.
To find the average of a set of numbers, add up all the items and divide by...
a)
2.
b)
The smallest number
c)
The largest number
d)
The number of items in the set.
35.
The mode score on the 6th grade math test was 94! Which of these interpretations must be correct?
a)
99 was the highest score on the test.
b)
More students received a 94 than any other score
c)
No student scored below a 50
d)
A score of 91 was slightly below average.
36.

What is the range in gas mileage for cars?

a)

2

b)

3

c)

4

d)

6

37.
What is the MEAN for this data?
a)
80
b)
1040
c)
13
d)
81
38.

What is the median number of minutes read by the students?

a)

45

b)

40

c)

50

d)

55

39.
What is the range?
a)
The average
b)
The number in the middle
c)
The largest number - the smallest number
d)
The number that appears most often
40.
What is the median?
a)
The number in the middle.
b)
The greatest number - the least number
c)
The average
d)
The number that appears most often.
41.
In order to find the median, the data must be sorted from least to greatest first.
a)
True
b)
False
42.
Dr. Dre is a dentist. He needs to report on the average number of cavities that his patients have.
1, 0, 1, 5, 0, 3, 4.  What is the average number of cavities?
a)
14
b)
2
c)
7
d)
1
43.
Find the mode of these numbers:
4,4,6,6,2,2,6,2,4,2
a)
2
b)
4
c)
6
d)
2.4
44.
Find the median of these numbers:
4,2,7,4,3
a)
2
b)
5
c)
7
d)
4
45.
Find the mean of these numbers:
2, 57, 38, 42, 6
a)
29
b)
38
c)
50
d)
145
46.
Find the median of these numbers:
4,2,7,4,3
a)
2
b)
5
c)
7
d)
4
47.
Roger bowled 7 games last weekend. His scores are: 155, 165, 138, 172, 127, 193, 142. What is the range of Roger's scores?
a)
193
b)
127
c)
60
d)
66
48.

Find the MEAN of these numbers

1, 9, 3, 6, 7, 5, 4, 5, 5

a)

6

b)

5.34

c)

5

d)

3.14

49.

Find the MODE of these numbers

1, 9, 3, 6, 7, 5, 4, 5, 5

a)

4

b)

7

c)

3

d)

5

50.

Find the MEDIAN of these numbers

1, 9, 3, 6, 7, 5, 4, 5, 5

a)

7

b)

1

c)

5

d)

4

51.

Find the RANGE of these numbers

1, 9, 3, 6, 7, 5, 4, 5, 5

a)

8

b)

6

c)

7

d)

9

52.
What is the minimum value?
a)
64
b)
58
c)
66
d)
60
53.
What is the maximum value?
a)
58
b)
66
c)
64
d)
60
54.
What data value is the upper quartile (Q3)?
a)
64
b)
62
c)
66
d)
58
55.
Roger bowled 7 games last weekend. His scores are: 155, 165, 138, 172, 127, 193, 142. What is Roger's median score?
a)
127
b)
155
c)
156
d)
193
56.
What value is the lower quartile?
a)
66
b)
58
c)
60
d)
64
57.
What is the median?
a)
62
b)
58
c)
66
d)
60
58.
What is the interquartile range (IQR)?
a)
4
b)
64
c)
60
d)
8
59.
Which box and whisker plot has the highest median?
a)
Top plot
b)
Bottom plot
60.
What is the term for the median of the lower half of the data?
a)
Lower Quartile
b)
Upper Quartile
c)
Median
d)
Maximum
61.
What is the term for the median of the upper half of the data?
a)
Upper Quartile
b)
Lower Quartile
c)
Median
d)
Minimum
62.
What is the median of the data?
a)
200
b)
100
c)
90
d)
140
63.
What is the interquartile range?
a)
4
b)
6
c)
2
d)
8
64.
What is the median of the data?
a)
200
b)
100
c)
90
d)
140
65.
Which restaurant has a higher median wait time?
a)
Lucy's Steakhouse
b)
Gary's Grill
c)
They are the same
66.
What is the minimum value?
a)
64
b)
58
c)
66
d)
60
67.
What data value is the upper quartile (Q3)?
a)
64
b)
62
c)
66
d)
58
68.
What value is the lower quartile?
a)
66
b)
58
c)
60
d)
64
69.
Which of the following best describes the process of finding the interquartile range for a set of data?
a)
Add the biggest and smallest numbers.
b)
Place the numbers in order from least to greatest and find the middle.
c)
Find the difference between the maximum and the minimum.
d)
Subtract Q1 from Q3.
70.
Find the Median
a)
98
b)
93
c)
78
d)
85
71.
Find the Median
a)
12
b)
14
c)
20
d)
5
72.
Which box and whisker plot has the highest median?
a)
Top plot
b)
Bottom plot
73.

Students recorded the amount of minutes they spend watching TV. Using the box plot shown above, what is the first quartile?

a)

30

b)

24

c)

60

d)

78

74.

The faculty of BMS were asked to state their age. The results are shown above in the box plot. What is the minimum age found in the box plot?

a)

23

b)

33

c)

42

d)

20

75.

Mr. Fisk, Ms. Martinez, and Mrs. Smeltzer, gathered every 6th grade math score on the test they took, which is shown in the box plot above. What is the median score the 6th grade students received?

a)

64

b)

70

c)

84

d)

72

76.

The box plot shown above shows the length of time (minutes) children spent in the swimming pool. What is maximum amount of time the children spent in the swimming pool?

a)

95

b)

70

c)

77.5

d)

50

77.

Students were asked how many minutes they spent reading last night for ELA. Using the box plot above, what is the third quartile?

a)

47.5

b)

40

c)

75

d)

50

78.

How do I find the Interquartile Range (IQR) on a box plot?

a)

Add the min. and max.

b)

Add Q1 and Q3

c)

Subtract Q1 and Q3

d)

Subtract the min. and max.

79.

Based on the box plot above, how do I find the IQR?

a)

45 - 33

b)

45 + 33

c)

23 + 58

d)

58 - 23

80.

Students recorded the amount of minutes they spend watching TV. Using the box plot shown above, what is the median?

a)

72

b)

120

c)

60

d)

78

81.

The box plot shown above shows the length of time (minutes) children spent in the swimming pool. What is median amount of time the children spent in the swimming pool?

a)

50

b)

30

c)

40

d)

77

82.

The faculty of BMS were asked to state their age. The results are shown above in the box plot. What is the first quartile from the box plot?

a)

23

b)

33

c)

42

d)

20

83.

Mr. Fisk, Ms. Martinez, and Mrs. Smeltzer, gathered every 6th grade math score on the test they took, which is shown in the box plot above. What is the third quartile score the 6th grade students received?

a)

64

b)

70

c)

84

d)

72

84.

Using the box plot above, how would I find the Interquartile Range (IQR)?

a)

50-30

b)

60-30

c)

60+30

d)

80-20

85.

Using the box plot above, what is the median amount of stuffed animals owned by students?

a)

50

b)

30

c)

60

d)

20

86.

What does median mean?

a)

In the middle

b)

When you add it all up and divide by how many numbers you just added

c)

Smallest number minus the biggest number

d)

most repeated number

87.

What does range mean?

a)

In the middle

b)

When you add it all up and divide by how many numbers you just added

c)

Smallest number minus the biggest number

d)

most repeated number

88.
How many students scored between a 86 and a 90?
a)
1
b)
3
c)
6
d)
10
89.
What is the interquartile range?
a)
4
b)
6
c)
2
d)
8
90.
What is the median of the data?
a)
200
b)
100
c)
90
d)
140
91.
Which car club has the higher median?
a)
Cruisers
b)
Car Hops
92.
What do you do if there are two numbers in "the middle" when you are finding the median?
a)
Pick your favorite number
b)
Add the two numbers in the middle & then divide by two.
c)
They are both the median
d)
None of the above
93.
What was the day with the least amount of cars sold? 
a)
Monday
b)
Tuesday
c)
Wednesday
d)
Thursday
94.
How many ladies from age 40-50 visited the library?
a)
8
b)
6
c)
7
d)
9
95.
How many students spent over 40 minutes but under 60 minutes studying?
a)
22 Students
b)
30 Students
c)
8 Students
d)
5 Students
96.
What is the interquartile range (IQR)?
a)
4
b)
64
c)
60
d)
8
97.
What is the term for the median of the lower half of the data?
a)
Lower Quartile
b)
Upper Quartile
c)
Median
d)
Maximum
98.
What is the term for the median of the upper half of the data?
a)
Upper Quartile
b)
Lower Quartile
c)
Median
d)
Minimum
99.
Which interval shows the greatest number of pets?
a)
15-19
b)
0-4
c)
5-9
d)
10-14
100.

Interquartile Range is

a)

the difference between the third quartile and the first quartile

b)

the difference between the greatest and least data values.

101.

Range is

a)

the difference between the third quartile and the first quartile

b)

the difference between the greatest and least data values.

102.
What percent of students have a height between 58 inches and 60 inches?
a)
25%
b)
50%
c)
75%
d)
100%
103.
What percentage of the data is between 90 and 140?
a)
25 %
b)
50%
c)
75%
d)
100%
104.
How many more people studied for 0-30 minutes than people who studied for 121-150 minutes?
a)
3
b)
6
c)
5
d)
4
105.
How many people were polled?
a)
33
b)
6
c)
35
d)
4
106.

For how many weeks was the data collected?

a)

48

b)

50

c)

52

d)

54

107.

What is the mode for this data set? Remember the mode is the most common or most frequent data.

a)

3

b)

4

c)

5

d)

6

108.

What is the range for this data set? Remember to subtract the minimum value from the maximum value.

a)

5

b)

6

c)

7

d)

8

109.
How many cities have temperatures between 70 degrees and 99 degrees?
a)
44
b)
34
c)
26
d)
62
110.
Neal is going to buy an automobile and needs to spends less than $35,000 in order to afford the monthly payment. Looking at the histogram, how many automobiles does Neal have to choose from?
a)
105
b)
35
c)
20
d)
125
111.
Which interval has 400 employees?
a)
33-43
b)
0-10
c)
77-87
d)
66-76
112.
How many employees have a salary less than $22,000?
a)
50
b)
350
c)
0
d)
10
113.
If Raul measured another tree in the orchard, which is most likely the height of the tree?
a)
12 feet
b)
21 feet
c)
3 feet
d)
19 feet
114.
How many more people like drama than sci-fi movies?
a)
12
b)
1
c)
13
d)
10
115.
What is the percent difference between comedy and action?
a)
22%
b)
5%
c)
13%
d)
10%
116.
What was the most popular type of movie? (mode)
a)
action
b)
comedy
c)
horror
d)
drama
117.
How many cyclists finished in 55-59 minutes?
a)
0
b)
9
c)
7
d)
5
118.
How many total cyclists are represented in the data?
a)
20
b)
24
c)
18
d)
22
119.
What percent of cyclists finished in 60-64 minutes?  Make a fraction first
a)
30%
b)
33%
c)
25%
d)
37.5%
120.
What percent of lunches cost $2.42 to $2.87?  Make a fraction first
a)
5%
b)
25%
c)
20%
d)
15%
121.

Which of the following is represented by the histogram?

a)

Of the 20 riders represented in the graph, over 50% are 30 years of age or older.

b)

One fourth of the riders represented in the graph are younger than 40 years old.

c)

Half the riders represented in the graph are between the ages 10-29.

d)

Six percent of the riders represented in the graph are between the ages 10 and 19.

122.

True or False? Over 50% of the students watch between 5 and 14 hours of television on the weekend?

a)

TRUE

b)

FALSE

123.
What is an interval?
a)
A single number
b)
A range of numbers
c)
A percentage
d)
A total amount
124.
Find the Mean Absolute Deviation:  10, 9, 3, 8, 10.  The Mean is 8
a)
3
b)
5
c)
1
d)
2
125.
Find the Mean Absolute Deviation:  5, 11, 2, 7, 16.  The Mean is 8.2 
a)
3.2
b)
2.8
c)
1.2
d)
4.2
126.
Which dot plot shows more consistency? a or b?
a)
a
b)
b
127.
Which dot plot shows more variability? a or b?
a)
a
b)
b
128.
What is the first step when calculating the Mean Absolute Deviation?
a)
Find the distance each value is from the mean
b)
Find the mean of the distances
c)
Find the mean of the data
129.
What is the second step when calculating the Mean Absolute Deviation?
a)
Find the distance each value is from the mean
b)
Find the mean of the distances
c)
Find the mean of the data
130.
What is the third step when calculating the Mean Absolute Deviation?
a)
Find the distance each value is from the mean
b)
Find the mean of the distances
c)
Find the mean of the data
131.
In calculating MAD, after you find the average or mean you must _____________. 
a)
do nothing because you're done
b)
Find out the distance each number is from the mean.
c)
Find the distance each number is from zero.
132.
Find the MAD:
58, 38, 54, 48, 26, 36
a)
43
b)
20
c)
10
d)
12
133.
a)

126

b)

8.4

c)

18

d)

Don't be MAD

134.
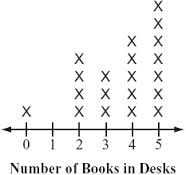
How many people have four books in their desks?
a)
2
b)
3
c)
4
d)
5
135.
How many people have two or less books in their desk?
a)
4
b)
5
c)
6
d)
7
136.
Describe the histogram:
a)
Left Skewed
b)
Symmetrical
c)
Right Skewed
d)
Uniform
137.
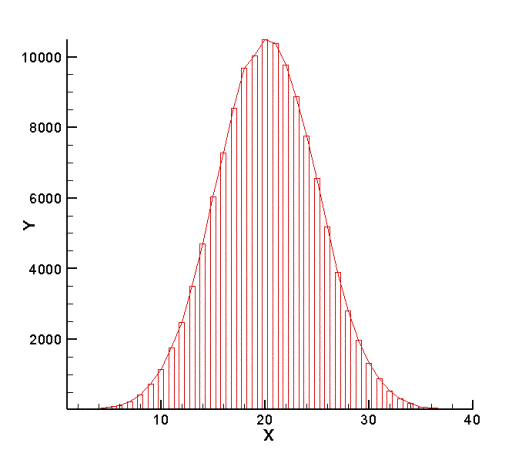
Describe the shape of the graph.
a)
Skewed right
b)
Skewed left
c)
Uniform
d)
Symmetrical
138.
Describe the shape of the graph.
a)
Skewed right
b)
Skewed left
c)
Uniform
d)
Symmetrical
139.
1. Which of the following best describes the process of finding the range for a set of data?
a)
ADD the biggest and smallest numbers
b)
Place the number in order from least to greatest then find the middle.
c)
Find the difference between the Maximum and the Minimum.
d)
Find the average.
140.
A data set can have more than one median?
a)
True
b)
False
141.
What is the mode?
a)
# happening the most
b)
the average
c)
biggest - smallest
d)
the middle #
142.
Find the mode.
7, 1, 1, 7, 1, 4, 1
a)
7
b)
3
c)
1
d)
4
143.
In the last 5 games, Kevin Durant scored 22, 22, 18, 12, and 21 points. What is Durant's Mean (Average) score per game?
a)
 19 points per game
b)
95 points per game
c)
18.6 points per game
d)
22 points per game
144.
How would you describe this distribution?
a)
Left skewed
b)
Uniform
c)
Right Skewed
d)
Symmetrical
145.
Extreme values are also known as what?
a)
interquartile ranges
b)
modes
c)
medians
d)
outliers
146.
Which is the correct data set for the dot plot?
a)
1, 2, 3, 4, 5, 6, 7, 8, 9, 
b)
1, 2, 2, 3, 3, 3, 4, 4, 4, 4, 5, 5, 5, 7, 9
c)
1, 2, 3, 4, 5, 7, 9
147.
What data value is the upper quartile (Q3)?
a)
64
b)
62
c)
66
d)
58
148.
Roger bowled 7 games last weekend. His scores are: 155, 165, 138, 172, 127, 193, 142. What is Roger's median score?
a)
127
b)
155
c)
156
d)
193
149.
What value is the lower quartile?
a)
66
b)
58
c)
60
d)
64
150.
Which box and whisker plot has the highest median?
a)
Top plot
b)
Bottom plot
151.
33, 25, 42, 25, 31, 37, 46, 29, 38
What is the third quartile (UQ) of the data?
a)
37
b)
38
c)
40
d)
46
152.
What is the mode?
a)
88%
b)
89%
c)
97%
d)
91%
153.
What is the range of the data shown?
a)
85
b)
90
c)
80
d)
70
154.
What is the range in gas mileage for SUVs?
a)
2
b)
3
c)
4
d)
6
155.
Each dot represents 1 day. How many days were recorded?
a)
9
b)
21
c)
20
d)
105
156.
What is the second step when calculating the Mean Absolute Deviation?
a)
Find the distance each value is from the mean
b)
Find the mean of the distances
c)
Find the mean of the data
157.
Which of the following is the mean absolute deviation for the set of data?
2.50 3.75 1.25 2.25 3.00
a)
3.3
b)
0.66
c)
2.50
d)
2.55
158.
Find the MAD:
58, 38, 54, 48, 26, 36
a)
43
b)
20
c)
10
d)
12
159.

What is the shape of the distribution?

a)

Symmetrical

b)

Uniform

c)

Skewed Right

d)

Skewed Left

160.

What is the shape of the distribution?

a)

Skewed Left

b)

Skewed Right

c)

Symmetric

d)

Uniform

161.

What is the shape of the distribution?

a)

Skewed Left

b)

Skewed Right

c)

Symmetric

d)

Uniform

162.
7. The choir director in a high school wants to know how the students in the school feel about singing. If the director selects 100 girls and 100 boys to complete a survey, which method will result in a biased sample?
a)
A. The students will be selected from the choir.
b)
B. The students will be selected randomly throughout the school.
163.
As part of a 6th grade statistics project, the teacher brings a candy jar full of gumballs (red & green). The assignment is to estimate the proportion of red gumballs in the jar. Suppose one of the students draws 25 gumballs from the jar: 8 are red, 17 are green. What is the SAMPLE?
a)
25 gumballs drawn
b)
all gumballs in the jar
c)
the students
d)
the 17 green gumballs
164.

A survey asked 72 randomly chosen students if they were going to attend the school play. Twelve said yes. If there are 210 tickets sold for the play, predict the number of students who attend the school.

a)

12 students

b)

72 students

c)

35 students

d)

Not enough information

165.
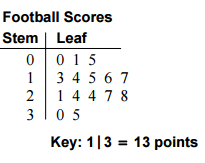
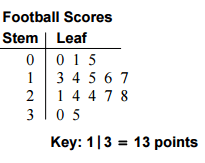
How many games did the team play?
a)
15
b)
12
c)
24
d)
14
166.
In how many games did the team score more than 20 points?
a)
8
b)
7
c)
10
d)
9