
 Worksheets
Statistics and Probability Quiz - Mr. V
Total questions: 10
Worksheet time: 23mins
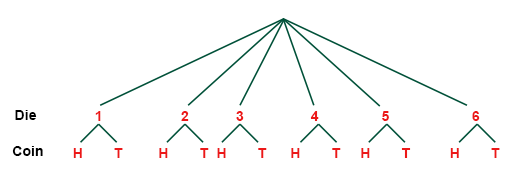
How many total outcomes are there?

What is the probability that you will get mushrooms on your pizza?
2/10 = 20%
2 = 20%
2/5 = 40%
1/4 = 25%

This is the test scores for two different classes. Which class has a greater mode?
2009 class
2010 class
neither
Same
Dennis kept track of the high temperature for 2 weeks in October. Here are the temperatures he recorded:
82, 81, 81, 86, 77, 82, 86, 82, 75, 73, 73, 64, 59, 55
Which stem and leaf plot correctly shows this data?


Edward drove 80 miles from his home to London.
He stopped and visited his friend Nicola on the way. Here is the distance-time graph for the journey.
How far was Edward from home when he visited Nicola?
30 miles
40 miles
10 miles
45 miles

AFTER the refrigerator, which appliance is used the most on weekdays?

Which city had the most bus riders in 2014?
Portland
Atlanta
Minneapolis
Miami

Find the probability of drawing a 10 from a standard deck of 52 cards.
1 out of 52
13 out of 52
26 out of 52
1 out of 13

Of the mechanical engineers, what is the probability that math is their favorite subject?
19.1%
What is the solution to the following equation?
6x + 8 = 3x + 44
x = 6
x = 12
x = 5
x = 8

