
 Worksheets
AP Stats Semester 1 Review
Total questions: 150
Worksheet time: 7hrs 39mins
An attribute that can take different values for different individuals.
Variable
Population
Individual
Statistics
Which of the following is a categorical variable?
GPA
Pulse Rate
Test Score
Favorite Ice Cream
A _______________ takes number values that are quantities.
Categorical Variable
Quantitative Variable
Population
Individual
A ____________________ is a quantitative variable that takes on a fixed set of possible values with gaps between them.
Discrete
Continuous
Population
Statistic
A quantitative variable that can take any value in an interval on the number line is a...
Discrete Variable
Continuous Variable
Population
Sample
Jake wants to find out more about the vehicles that his classmates drive. He gets permission to go to the students parking lot and records some data. Later, he does some research on each model of car he found. Finally, Jake makes a spreadsheet that includes each car's license plate, model, number of cylinders, color, highway gas mileage, weight, and whether it has a navigation system.
The individuals in Jake's Study are...
Jake's Classmates
The Cars
The Cars in the Student Parking Lot of Jake's School
The Models of Cars
Jake wants to find out more about the vehicles that his classmates drive. He gets permission to go to the students parking lot and records some data. Later, he does some research on each model of car he found. Finally, Jake makes a spreadsheet that includes each car's license plate design, model, number of cylinders, color, highway gas mileage, weight, and whether it has a navigation system.
How many quantitative variables is Jake measuring?
3
4
2
Unable to tell without the data
Jake wants to find out more about the vehicles that his classmates drive. He gets permission to go to the students parking lot and records some data. Later, he does some research on each model of car he found. Finally, Jake makes a spreadsheet that includes each car's license plate design, model, number of cylinders, color, highway gas mileage, weight, and whether it has a navigation system.
How many categorical variables is Jake measuring?
3
4
2
Unable to tell without the data
Jake wants to find out more about the vehicles that his classmates drive. He gets permission to go to the students parking lot and records some data. Later, he does some research on each model of car he found. Finally, Jake makes a spreadsheet that includes each car's license plate design, model, number of cylinders, color, highway gas mileage, weight, and whether it has a navigation system.
Is the variable "number of cylinders" discrete or continuous?
Discrete
Continuous
Jake wants to find out more about the vehicles that his classmates drive. He gets permission to go to the students parking lot and records some data. Later, he does some research on each model of car he found. Finally, Jake makes a spreadsheet that includes each car's license plate design, model, number of cylinders, color, highway gas mileage, weight, and whether it has a navigation system.
Is the variable "weight" discrete or continuous?
Discrete
Continuous
Which graphs could you use to represent categorical data? (Select all that apply).
Bar Graph
Histogram
Pie Chart
Box and Whisker Plot
Which graphs could you use to represent quantitative data? (Select all that apply).
Bar Graph
Histogram
Pie Chart
Box and Whisker Plot
Which of the following shoes the proportion or percent of individuals that have a certain value?
Frequency Table
Relative Frequency Table


On Saturday, Bernardo gave his guinea pig 80 grams of food. The table shows the amount of each type of food he gave to the guinea pig.
Which segmented bar graph best represents the data?


Which statement is true based on the segmented bar graph above?
The number of kids with cell phones is about the same for ages 13-15 and 16-18
About 75% of kids with cell phones are ages 13-15
About 75% of kids age 13-15 have a cell phone
320 kids were involved in this surve

What is this graph?
Segmented Bar graph
Histogram
Bar graph
side-by-side bar graph
A _________ shows each data value as a dot above its location on a number line.
dot plot
box and whisker plot
histogram
mosaic plot

Type of Data arrangement
Symmetrical
Hairline
Skewed Right
Skewed Left





What is the shape of the distribution?
Skewed Left
Skewed Right
Symmetric
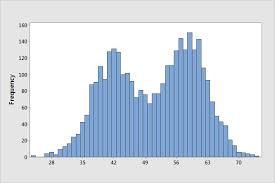
What is the shape of the distribution?
Skewed Left
Skewed Right
Symmetric
Bimodal
$78, $79, $81, $82, $83
Two days later, another store has the same shoes on sale for $65. How does the new price affect the data?
2, 5, 12, 15, 19, 4, 6, 11, 16, 18, 12, 12, 42
What effect does removing the outlier have on the distribution of the data?

Which of the boxpots has the larger larger interquartile range?
female
male
they're the same
impossible to tell
Which value(s) are outlier(s) for the age of male Oscar winners?
80
76
60
29
When using IQR to find outliers, which formula will identify the lower limit?
Q3 - 1.5(IQR)
Q1 + 1.5(IQR)
Q1 - 1.5(IQR)
Q3 + 1.5(IQR)
84, 88, 72, 74, 98, 16, 94
To adequately describe a distribution of quantitative data, you need to describe the...
Shape, Center, Variability, and Outliers/Unusual Features
Direction, Strength, Form, and Outliers/Unusual Features
Only shape because we will not always be able to find the center



How many students scored at least 4 points?
0
3
8
11

How many cities have temperatures between 70 degrees and 99 degrees?
44
34
26
62


Which of the follow measure the center of a symmetrical distribution? (select all that apply)
Mean
Median
Mode
Maximum
Which of the following measure the variability of a distribution? (select all that apply).
Mean
Median
Range
Standard Deviation
IQR
If a distribution is skewed to the right with no outliers, which expression is correct?
mean < median
mean ≈ median
mean = median
mean > median
We can't tell without examining the data
the percent of observations less than or equal to an individual
Percentile
Z-score
Table A
normalcdf
If I tell you that you scored at the 55th percentile on your final exam, you would know:
55% of the class scored the same or worse than you did
You earned a 55% on the exam
You failed the exam
45% of the class scored worse than you did
A student recently took the SATs and their score correlated to the 60th percentile. This means that ______________ percent of all students score at or higher than the score the student received.
60
40
20
100
For Mrs. V: mean = 55 and standard deviation = 19
For Mr. T: mean = 33 and standard deviation = 10.5
Mary Beth is very proud of the score of 80 that she earned in Mrs. V's class. Albert is equally proud of the score of 42 he earned in Mr. T's class. Who has the better score?
Mary Beth
Albert
The sign of the z-score indicates whether the location is above(positive) or below(negative) the mean.
True
False
Find the z-score value corresponding if the location is below the mean by 2 standard deviations
+2.00
-2.00
+1.25
-1.00
Find the Z-score.
Mean = 22
Standard Deviation: 3.1
x = 29
2.26
16.45
-2.26
1.26
Find the z-score.
Mean = 38
Standard Deviation: 1.2
x = 42
3.33
-3
3.03
-3.33
Find the area under the standard normal curve that is to the left of z=0.88.
0.1894
0.8106
1.1750
-1.1750
Find the area under the standard normal curve that is to the right of 0.46
0.1004
.3111
0.6772
0.3228
If 30 is added to every observation in a data set, the only one of the following that is not changed is
the mean
the 75th percentile
the median
the standard deviation
the minimum
At a company, all of the employees got a 3% raise plus a $500 bonus at Christmas time. If the mean salary before the raise was $59,000, what is the new mean? (New=1.03 x Old + 500)
60770
59500
61285
61270
At a company, all of the employees got a 3% raise plus a $500 bonus at Christmas time. If the standard deviation of the salaris before the raise was $5,000, what is the new standard deviation? (New=1.03 x Old + 500)
5150
5650
5000
5500
Then, 68% of all tires will have a life between ___________ km and __________ km.
About what percent of the products last between 12 and 15 days?

What is the percentage of data that falls within three standard deviations of the mean?
99.7%
98.7%
95%
100%
Which of the following measures the outcome of a study?
The Response Variable
The Explanatory Variable
Which of the following may help predict or explain changes?
The Response Variable
The Explanatory Variable
When describing the association between two variables on a scatterplot, you need to address the following. (Select all that apply).
Shape
Form
Strength
Center
Direction

What is the correlation for the following Scatter Plot.
Weak Positive
No Correlation
Strong Negative
Weak Negative
Strong Positive

What is the correlation for the following Scatter Plot.
Weak Positive
No Correlation
Strong Negative
Weak Negative
Strong Positive

What is the correlation for the following Scatter Plot.
Weak Positive
No Correlation
Strong Negative
Weak Negative
Strong Positive

Given the following Scatter Plot, select the option that is most likely the r value.
r=.27
r=−.862
r=.934
r=.54

Given the following Scatter Plot, select the option that is most likely the r value.
r=−.45
r=−.981
r=.728
r=.12
Correlation coefficient is the statistic that measures the strength and direction of a linear association between two quantitative variables.
True
False
If r=0, there is a strong correlation.
True
False
r = -0.3 is considered to have...
moderate negative correlation
weak negative correlation
no correlation
strong negative correlation
Which of the following statements about correlation is true?
Correlation has no units
Correlation shows causation
Correlation is resistant to outliers
Correlation can be used for all types of relationships, not just linear
The use of a regression line for prediction outsides the interval of x values used to obtain the LSRL.
Extrapolation
Interpolation
Correlation
Residual
The difference between the actual value of y and the predicted value of y predicted by the LSRL.
Residual
Slope
Y-Intercept
Correlation
The predicted value of y when x = 0
Slope
Y-Intercept
Residual
Correlation
The amount by which the predicted value of y changes when x increases by 1 unit.
Slope
Y-Intercept
Correlation
Residual
The line that makes the sum of the squared residuals as small as possible.
LSRL
Slope
Y-Intercept
Linear Model


Can you predict the battery life of a tablet using the price? Using the data from a sample of 15 tablets, the LSRL y-hat=4.67 + 0.0068x was calculated using x=price in dollars and y= battery life in hours. S=1.21 and r2=0.342. Which is the correct interpretation of the coefficient of determination.
34.2% of the variability in battery life is explained by the LSRL with x=price in dollars.
The actual battery life in hours is typically 1.21 hours away from the battery life predicted by the LSRL
There is a weak positive linear association between price in dollars and battery life.
We predict the battery life of a tablet will increase 0.0068 hours for each increase of $1 in price
Can you predict the battery life of a tablet using the price? Using the data from a sample of 15 tablets, the LSRL y-hat=4.67 + 0.0068x was calculated using x=price in dollars and y= battery life in hours. S=1.21 and r2=0.342. Which is the correct interpretation of the standard deviation of residuals.
34.2% of the variability in battery life is explained by the LSRL with x=price in dollars.
The actual battery life in hours is typically 1.21 hours away from the battery life predicted by the LSRL
We predict that a tablet that cost $0 would have a battery life of 4.67 hours.
We predict the battery life of a tablet will increase 0.0068 hours for each increase of $1 in price
The equation of the LSRL for the points on a scatterplot is ŷ = 5.3-0.23x. What is the residual for the point (5, 4)?
-0.15
0.15
1
0.62
0.85


A high school counselor wants to look at the relationship between the grade point average (GPA) and the number of absences for students in the senior class this past year. The data show a linear pattern with the summary statistics shown. Find the equation of the least-squares regression line for predicting GPA from the number of absences.
y = 3.7125 − 0.1625x
x: # of absences
y: GPA
y = 2.0875 − 0.1625x
x: # of absences
y: GPA
y = -10.1 − 2.6x
x: # of absences
y: GPA
y = 15.9 − 2.6x
x: # of absences
y: GPA

Desiree is interested to see if students who consume more caffeine tend to study more as well. She randomly selects 20 students at her school and records their caffeine intake (mg) and the number of hours spent studying. A scatterplot of the data showed a linear relationship. Which statement about the slope is true?
For each additional 1 hour of study time, the caffeine intake is predicted to increase by 0.164 mg.
For each additional 1 hour of study time, the caffeine intake is predicted to decrease by 0.164 mg.
For each additional 1 mg of caffeine, the study time is predicted to increase by 0.164 hours.
For each additional 1 mg of caffeine, the study time is predicted to decrease by 0.164 hours.
Desiree is interested to see if students who consume more caffeine tend to study more as well. She randomly selects 20 students at her school and records their caffeine intake (mg) and the number of hours spent studying. A scatterplot of the data showed a linear relationship. Which statement about the y-intercept is true?
When the caffeine intake is 0 mg, the study time is predicted to be 2.544 hours.
When the caffeine intake is 0 mg, the study time is 2.544 hours.
When the caffeine intake is 0 mg, the study time is predicted to be 0.164 hours.
When the caffeine intake is 0 mg, the study time is 0.164 hours.
Desiree is interested to see if students who consume more caffeine tend to study more as well. She randomly selects 20 students at her school and records their caffeine intake (mg) and the number of hours spent studying. A scatterplot of the data showed a linear relationship. How large is a typical prediction error from the actual study time when using this model to predict study time from caffeine intake?
1.532 milligrams
1.532 hours
60.032%
2.544 hours
Desiree is interested to see if students who consume more caffeine tend to study more as well. She randomly selects 20 students at her school and records their caffeine intake (mg) and the number of hours spent studying. A scatterplot of the data showed a linear relationship. About what percentage of the variation in study time can be explained by the regression on caffeine intake?
16.4%
25.4%
58.6%
60.0%
Identify the sampling method:
Every fifth person boarding a plane is searched thoroughly.
SRS
Stratified
Cluster
Systematic
Voluntary Response
Identify the sampling method:
At a local community College, five math classes are randomly selected out of 20 and all of the students from each class are interviewed.
SRS
Stratified
Cluster
Systematic
Convenience
Identify the sampling method:
A researcher randomly selects and interviews fifty male and fifty female teachers.
SRS
Systematic
Stratified
Cluster
Convenience
Identify the sampling method:
A researcher for an airline interviews all of the passengers on five randomly selected flights.
SRS
Systematic
Stratified
Cluster
Convenience
Identify the sampling method:
Based on 12,500 responses from 42,000 surveys sent to its alumni, a major university estimated that the annual salary of its alumni was 92,500.
SRS
Cluster
Stratified
Convenience
Voluntary Response
Identify the sampling method:
A community college student interviews the first 100 students to enter the building to determine the percentage of students that own a car.
SRS
Stratified
Cluster
Convenience
Voluntary Response
Identify the sampling method:
To avoid working late, the quality control manager inspects the last 10 items produced that day.
SRS
Systematic
Convenience
Voluntary Response
Cluster
Identify the sampling method:
The names of 70 contestants are written on 70 cards, The cards are placed in a bag, and three names are picked from the bag.
SRS
Systematic
Stratified
Cluster
Convenience
A company wants to know the opinion of a rural community on a proposed ballot initiative. Half of the community does not have internet access, so the company sends emails to the 380 members that do have internet access. Of those surveyed, 372 of the community members responded to the survey. Which of the following is the most significant source of bias in the survey?
Voluntary Response Bias
Undercoverage
Nonresponse Bias
Response Bias
A radio station is discussing a controversial policy enacted by the local police department. They poll listeners by having them call in to the radio station. Which of the following is the most significant source of bias?
Leading questions on the survey
Voluntary Response Bias
Survivorship Bias
Undercoverage
Which of the following would theoretically determine the exact value of a parameter?
A simple random sample
A cluster sample
A census
A stratified random sample
Which of the following surveying methods divides individuals by a shared attribute, then randomly surveys members within each attribute-group?
Simple random
Stratified random
Cluster random
Strategic Random
Which of the following surveying methods involves randomly selecting groups of individuals, then surveys all individuals in the group?
Stratified Random
Simple Random
Cluster Random
Systematic
To randomly select 25 basketball players from the 300 players in the NBA, I would:
Number the players from 01-25, read 3 digits at a time from a random table, discarding repeats and numbers over 25, and then stop when I reach 25.
Number the players from 0-299, read 2 digits at a time from a random table, discarding repeats and numbers over 299, and stop when I reach 25.
Number the players from 01-299, read 2 digits at a time from a random table, discarding repeats and numbers over 300, and stop when I reach 25.
Number the players from 001-300, read 3 digits at a time from a random table, discarding repeats, 000 and numbers over 300, and stop when I reach 25.

If you have 1,000 schools on the list, number them from 000 to 999 and read the table three digits at a time. What are the first five schools in this sample?
24, 19, 83, 72, 41
241, 983, 724, 152, 579
2419, 8372, 4152, 5761, 0849
A group of librarians is interested in the numbers of books and other media that patrons check out from their library. They examine the checkout records of 150 randomly selected adult patrons.
The population is all adult patrons of the library; the sample is the 150.
The populations is all patrons of the library; the sample is the adult patrons of the library.
The population is all patrons is all patrons who check out at least 1 book from the library; the sample is the 150 patrons selected.
Identify the Population:
Gwinnett County Public Schools randomly selected 230 teachers to find out which technology resource is the most effective. 30 teachers chose Safari Montage, 45 selected Learn Zillion, 100 chose Ed Puzzle, and 55 chose Kahoot. GCPS concluded that all teachers prefer Ed Puzzle.
230 Teachers
100 Teachers
55 Teachers
All Teachers
Identify the Sample:
A restaurant wants to know if customers buy dessert when they eat out. As people leave the restaurant one evening, 20 people are surveyed at random. Eight people say they usually order dessert when they eat out. The restaurant concluded that most customers do not order dessert.
20 customers
8 customers
All customers
Dessert

Identify the shaded area...
A∩B
A∪B
A'∩B'
A'∪B'

Identify the shaded area...
A
B
A'
B'

Identify the shaded area...
A∩B
A∪B
A'∩B'
A'∪B'


Randomization is necessary for all of the following reasons EXCEPT
averaging out the effects of lurking (confounding) variables.
removing bias that could result if subjects drop out of the experiment before it finishes.
producing groups that should be similar to each other in all respects before the treatments are applied.
removing chance variation from the experimental results.
Which of the following is most important in minimizing the placebo effect?
Replication and randomization
Replication and blinding
Randomization and control
Blinding and control
Two studies are run to compare the experiences of low-income families receiving food stamps to those receiving cash subsidies. The first study interviews 50 families who have been in each government program for at least 2 years, while the second randomly assigns 50 families to each program and interviews them after 2 years. Which of the following is a true statement?
Both studies are observational studies because there are no control groups.
Both studies are experiments, because in each, families are receiving treatments (food stamps or cash).
The first study is an observational study; the second is an experiment.
The first study is an experiment; the second is an observational study.
X 50 20 5
P(X) 0.1 0.3 0.6
The mean amount of time to mix the batter for a cake is 14 minutes with a standard deviation of 2.5 minutes. The mean amount of time to bake the cake is 35 minutes with a standard deviation of 6.2 minutes. What is the mean time to make and bake a cake? What is the standard deviation?
mean = 49 min sd = 8.7 min
mean = 49 min sd = 6.685 min
mean = 21 min sd = 8.7 min
mean = 21 min sd = 6.685 min
The mean hourly salary for a high school graduate is $13.50 per hour with a standard deviation of $5.75. The mean hourly salary for a person with an Associate's degree is $19.75 with a standard deviation of $9.25. What is expected difference in the hourly salaries between a high school graduate and a person who earned an Associate's degree?
$33.25
$-3.50
$-6.25
$15.00
A random variable X has a mean of 120 and a standard deviation of 15. A random variable Y has a mean of 100 and a standard deviation of 9. If X and Y are independent, approximately what is the standard deviation of X – Y?
24.0
17.5
12.0
6.0
4.9
The mean of the sum or difference of two random variables is __________________.
the sum or difference of their respective means
found by adding or subtracting the original means and then dividing by two
The variance of the sum or difference of two independent random variables is ________________.
found by adding the two variances
found by adding or subtracting the two variances

