
 Worksheets
Review 1: Progress Check Elasticities and beyond
Total questions: 23
Worksheet time: 12mins
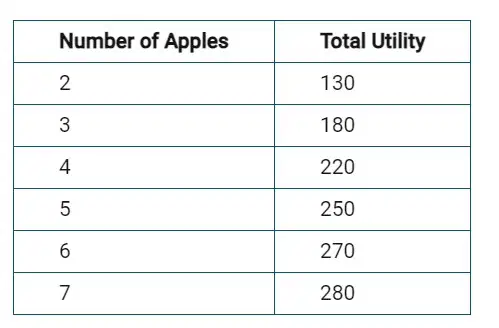
If the price of an apple is $0.50, the marginal utility per dollar spent on the fifth apple is:
[Topic: Marginal utility]
20
40
100
60

The marginal utility per dollar spent on the last orange consumed is 75. If the price of an apple is $0.50, how many apples would Johnny have to consume before he considers purchasing another orange?
[Topic: Marginal Utility]
2
3
4
6
Which of the following correctly describes the income effect associated with the law of demand?
[Topic: Income Effect]
If consumer income increases, there will be an upward movement along the demand curve for a normal good.
If the price of a good increases, the demand for the good decreases because the demand for its substitute in consumption increases.
If the price of a good decreases, the demand for the good increases because the lower price increases the demand for its complement in consumption.
If the price of a normal good decreases, the purchasing power of a consumer’s income increases and therefore consumers will be willing and able to purchase more of the good.
Which of the following will occur as a result of a decrease in the prices of the inputs used to produce a good?[Topic: Supply Shift]
The quantity supplied would increase at each possible price for the good.
The price of the good would increase for any given quantity supplied.
The quantity supplied would increase as the price of the good increased.
The price of the good would increase as the quantity supplied decreased.
Which of the following explains why the supply curve is upward sloping?
[Topic: Law of Supply]
Producers receive subsidies as they increase production.
At a higher quantity, producers are more able to control the market price.
At a higher quantity, producers are more able to control the market price.
At a higher price, producers are willing to sell more to increase their profits.
The market supply curve for a product is derived from the individual firm supply curves by
[Topic: Market Supply Curve]
multiplying the equilibrium quantity sold by the number of producers in the market
multiplying the quantities each producer sells by the market price
summing the quantities each producer sells and multiplying by the market price
summing the quantities each producer sells at each possible price
A 10 percent increase in the price of a good results in a 4 percent increase in total revenue. From this information, it can be concluded that the demand over this range of prices
[Topic: Elasticity and Total Revenue]
is upward sloping
is inelastic
has increased by 40%
has a price elasticity of demand equal to 2.5
A firm estimates that the absolute value of the price elasticity of demand for its signature sandwich is 2. If the firm increases its sandwich price by 10 percent, what will happen to the quantity demanded?
[Topic PED]
It will increase by 20 percent
It will decrease by 5 percent
It will decrease by 20 percent
It will remain unchanged

Which of the following statements is true about the demand curve above?
[Topic: Elasticity on a Linear D-Curve]
The elasticity of demand increases when moving from point X to point Y.
The elasticity of demand decreases when moving from point X to point Y.
Demand is elastic at each given price because the slope is constant and equal to −2.
Demand is elastic between quantities 4 and 8.
Which of the following would cause the supply of good X to become more elastic?
[Topic: Supply Elasticity]
A short time frame for making production decisions
Increased prices of inputs required to produce good X
The ability to easily reallocate inputs to production of good X
Greater availability of substitutes for good X
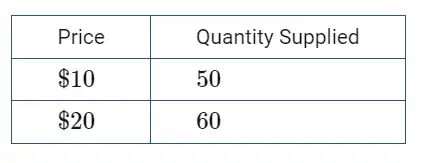
The supply schedule gives two points on a market supply curve.
Which of the following is true about the supply curve between the given points?
[Topic: PES]
The supply curve is perfectly elastic, because the change in price is $10 and the change in quantity supplied is 10 units.
The supply curve is unit elastic, because the change in price is $10 and the change in quantity supplied is 10 units.
The supply curve is inelastic, because the percentage change in the price is greater than the percentage change in the quantity supplied.
The supply curve is unit elastic, because the price elasticity of supply is equal to 1.
Suppose the price elasticity of supply for gasoline in the short run is estimated to be 0.4. Due to an unexpected surge in the demand for gasoline, the price of gasoline increases by 20 percent. As a result, the quantity supplied of gasoline will:
[Topic: Results of a Price Change with Inelastic Supply]
increase by 50 percent
increase by 20 percent
be impossible to determine from the given information
increase by 8 percent
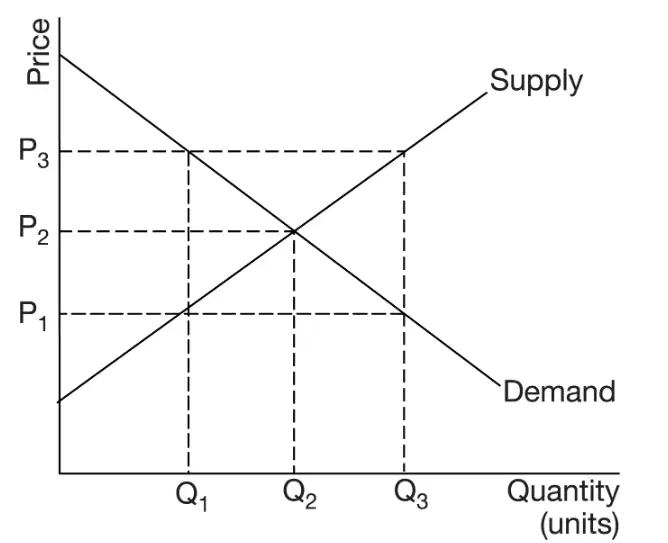
In the market described by the diagram above, the total economic surplus will be maximized at which of the following price and quantity combinations?
[Topic: Total Economic Surplus at Equilibrium]
At P3 and Q3
At P3 and Q1
P2 and Q2
At P1 and Q3

The table above shows the supply and demand schedules in the orange market. Assume that the demand and supply curves are linear.
At the market equilibrium price, what are the consumer surplus and the producer surplus?
[Topic: Calculating Consumer Surplus adn producer Surplus]
consumer surplus is $200; producer surplus is $200
consumer surplus is $100; producer surplus is $100
Consumer surplus is $50; producer surplus is $50
Consumer Surplus is 50 oranges; Producer Surplus is 50 oranges.
The market for tomatoes is in equilibrium at the price of $10, and quantity of 50 tomatoes. If consumer surplus is $400 and social surplus is $650, what is the producer surplus in the tomato market and why?
[Topic: Consumer Surplus (CS) and Producer Surplus (PS)]
The producer surplus is $0, because producer surplus is offset by the costs of producing tomatoes.
The producer surplus is $500, because the producer surplus is the equilibrium price times the equilibrium quantity =$10×50=$500.
The producer surplus is $250, because the social surplus less what consumers receive must go to producers.
The producer surplus is −$400, because consumer and producer surplus must offset one another.
Consider the market for arugula, a normal good. Which of the following changes would result in an increase in both the equilibrium price and the equilibrium quantity of arugula?
[Topic: Changes in Equilibrium]
decrease in consumer income
A decrease in the price of radicchio, a substitute in consumption
An increase in population
An increase in the price of salad dressing, a complement in consumption
Which of the following will initially result from an increase in the market demand for a good?
[Topic: Changes in equilibrium]
There will be a decrease in quantity supplied.
The equilibrium price will decrease.
There will be a matching increase in supply.
There will be a temporary shortage at the original equilibrium price.
Assume that the market for a good is characterized by a downward-sloping demand curve and an upward-sloping supply curve. Suppose that there is an improvement in technology for producing the good. Which of the following would occur?
[Topic: Changes in equilibrium]
The impact on consumer surplus would be indeterminate, because of the offsetting impact of the changes in equilibrium price and quantity.
The change in equilibrium price would cause producer surplus to increase.
The total economic surplus (social welfere) in the market would increase.
The supply curve would shift up resulting in an increase in the equilibrium price and the producer surplus
Because of conflict and political instability in Country Y, millions of its citizens emigrate to Country X. Which of the following best explains what will happen to Country X?
[Topic: Shifting the PPC]
Country X’s PPC will shift inward over time.
Country X’s production will move to a point on its PPC at which it produces only consumer goods.
Country X’s PPC will shift outward over time.
Country X’s PPC will not change, but its consumption of goods will decrease.
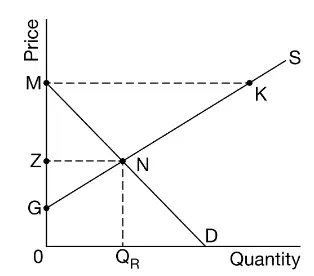
Based on the graph above, the consumer surplus at the market equilibrium price and quantity is shown by which area?
[Consumer Surplus]
NZKM
MNK
ZMN
GZN

Which of the following will enable an economy to reach point F on the diagram above?
Fully allocating currently available and unemployed resources efficiently
Reallocating currently available resources from apple production to production of oranges
Creating or discovering new resources
Reallocating currently available resources from orange production to production of apples

The above data describes a bakery’s daily production possibilities curve for doughnuts and sweet rolls. Which of the following is true about the PPC ?
Producing 0 doughnuts and 40 sweet rolls illustrates inefficiency in production.
The PPC illustrates decreasing opportunity cost.
The PPC illustrates constant opportunity cost.
PPC illustrates increasing opportunity cost.
Oren’s father tells Oren he can have one dessert after dinner. He can choose from a scoop of ice cream, a slice of apple pie, a cup of chocolate pudding, or a piece of fruit. Oren prefers chocolate pudding to a piece of fruit; he prefers apple pie to chocolate pudding; and he prefers ice cream to apple pie. If Oren chooses a scoop of ice cream, what is his opportunity cost?
[Topic: Opportunity Cost]
A piece of fruit.
A slice of apple pie.
A piece of fruit, a cup of pudding and a slice of apple pie.
A cup of chocolate pudding.

