
NEW
Font size
 Worksheets
Data Visualization Revision Excercise
Total questions: 40
Worksheet time: 20mins

Which of the following is the CORRECT Big Data characteristics based on the given scenario?
Variability
Variety
Velocity
Veracity
Which of these data represents discrete ratio data?
Age in years
Seniority level at work
Sales made in one month
Income in Ringgit Malaysia

Table 1 shows a list of data. Answer the following question based on the table. Which of the following list corresponds to the data type in Table 1?
Nominal, Ratio, Interval, Ordinal
Ordinal, Ratio, Nominal, Interval
Interval, Nominal, Ordinal, Ratio
Ratio, Ordinal, Interval, Nominal
What is the CORRECT chart to visualise the distribution of Customer Age data?
Scatter plot
Box Plot
Histogram
Horizontal Bar Chart

Prior to designing data visualisations, it is critical to identify target audience to communicate the way data scientists want the audience to assimilate the information. What do target audience expect to obtain from the visualisation?
I & II
I, II, & III
II, III, & IV
I, III &, IV

The following statements explain the role of charts EXCEPT
II & IV
I & II
III & IV
II & III
_________ is information boundary specified based on target audience backgrounds, needs and requirements for the need to communicate the information effectively.
Data visualisation
Data context
Data validation
Data acquisition
Data visualization can be in a form of infographics, charts, and graphs that helps users gain new insights. In many industries, it has been used to help users in expediting decision making with data stories. Based on this perspective, which of the following statements is NOT TRUE about data visualization?
It combines a set of data into a single page that shows trends, engages users to interact and understand the data easily.
Data visualization explains a process and record the information in a form of pictures, blueprints, or graphs.
It conveys meaningless information in a single page that allows the user to misinterpret the message.
To help people understand the significance of data by placing it in a visual context.
_________ is a type of ________ chart, used to display parts of a whole and change over time.
Stacked column chart, comparison
Scatter chart, distribution
Scatter chart, relationship
Pie chart, composition

Which of the following refers to continuous attributes?
I
II, III
I, IV
I, III, IV
________ data is any data which lies within a given range of two fixed values.
Discrete
Continuous
Nominal
Ordinal
Which of the following statements is FALSE?
Data visualization enable audience to absorb information quickly
Data visualization is another form of visual art
Data visualization reduces insights and leads to slower decision making
None of the above
Organizations that have a large amount of information stored in different systems should begin a big data analytics project. What do organizations need to consider when they embark on a big data analytics project?
Ability of business intelligence and analytics vendors to help them answer business questions in big data environments.
Proper plan for choosing and implementing big data infrastructure technologies.
Knowledge and skills to prepare, analyze and interpret data from various data sources.
Database with least data errors.
_____________ comprises processed, organized data presented in a meaningful context.
Data
Information
Raw data
Valid information
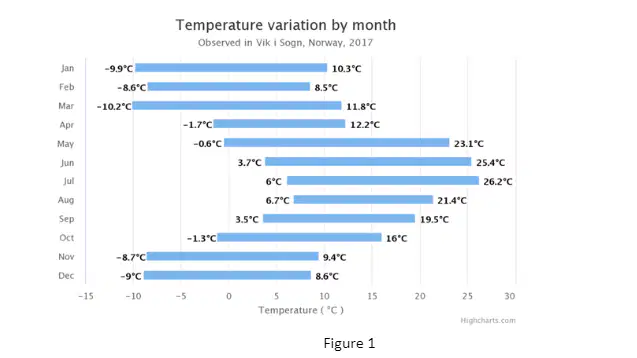
Which one of the following explains the purpose of the chart in Figure 1?
To show the maximum and minimum of temperature value.
To show the frequency of temperature by month.
To show the variety of temperatures in 2017.
To show the trends of temperature in 2017.
_________ is useful for showing relationship between two variables, can quickly see groups of points based on proximity, can quickly see correlation (if exist).
Line graph
Scatterplot
Heat map
Slopegraph
Which of the following is NOT TRUE about user requirements?
It contains the point of view is user towards the system
It explains the user goal and its relationship with organisation
It tells how well the system can perform the task given
It gathers the user input and output data or information on natural language
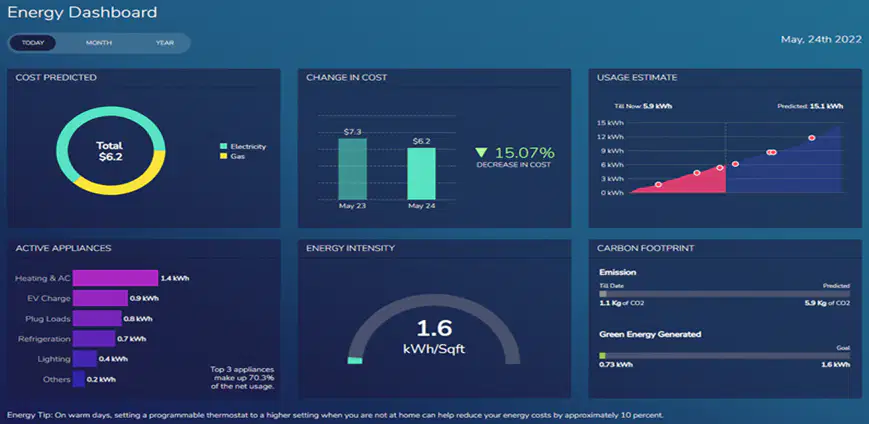
The following diagram shows an Energy Dashboard. Which of the following is a CORRECT statement that explains the Dashboard ?
Energy Dashboard helps the manager to indicate the performance of energy consumption by daily, monthly and yearly.
Energy Dashboard assists the operational staff to check the current status of energy consumptions and associated ingestions in a day.
Energy Dashboard helps analyse the cost and its usage for top level management for estimating the operational cost.
Energy Dashboard is being used as centre of information for an organisation to predict the future trends and pattern of energy usage.
"Many analysis problems are vaguely defined, making it difficult for people to know how to address them. In such cases, an analysis process with a human in the loop is the best way forward, because dashboard design makes use of the great pattern identification capabilities of the human visual system."
Identify the ideal process to solve the above issue.
Requirements gathering
Dashboard development
Reporting documentation
Data cleansing
Data structuring is one of the activities in the data transformation process. Which of the following tasks best describes the activity? ?
Identifies patterns, relationships and other attributes in the data, as well as inconsistencies, anomalies, missing values and other issues so they can be addressed.
Creating new fields or columns that aggregate values from existing ones.
Enhance and optimizes data sets as needed, through measures such as augmenting and adding data.
Data stored in comma-separated values (CSV) files or other file formats must be converted into tables to make it accessible to Business Intelligence and analytics tools
Choose the CORRECT principle with regard to gathering requirements.
i. Focus on the questions stakeholders are trying to answer rather than the specifics of how the dashboards will look.
ii. Ask “why?” when stakeholders describe what they are looking for.
iii. Don’t limit the discussion, but be sure to prioritize.
I
I & II
II & III
I, II & III

The following diagram shows a dashboard features embedded current CCTV pictures and a weather report. Choose the most suitable answer for the above type of dashboard.
Operational dashboard
Analytical dashboard
Strategic dashboard
Platform dashboard
Data cleansing is the process of fixing or removing incorrect, corrupted, incorrectly formatted, duplicate, or incomplete data within a dataset.
Which of the following statements is TRUE about the chunking method in data cleansing?
Turning a meaningful piece of data (such as an account number) into a random string of characters.
Marking up a word in a text (corpus) as corresponding to a particular part of speech, based on both its definition and its context.
Taking individual pieces of information and grouping them into larger units.
Aggregating individual observations of a variable into groups, so that a frequency distribution of these groups serves as a convenient means of summarizing or analyzing the data.
Prior to designing data visualisations, it is critical to identify target audience to communicate the way data scientists want the audience to assimilate the information. What do target audience expect to obtain from the visualisation?
I & II
I, II, & III
II, III, & IV
I, III &, IV
_________ is information boundary specified based on target audience backgrounds, needs and requirements for the need to communicate the information effectively.
Data visualisation
Data context
Data validation
Data acquisition
________ step is performed by a data scientist after acquiring the data.
Data cleansing
Data integration
Data replication
Data loading
_______ is what you do to understand the data and figure out what might be significant or interesting to highlight to others.
Explanatory analysis
Exploratory analysis
Predictive analysis
Data analysis
Below are the tips of designing a good dashboard, except:
group related matrix
use clear labels
use less colours
use big pictures

The green column in the following figure is derived from a data cleansing method performed. VLOOKUP function has been used to determine "Type of Work" based on hours-per-week attribute. Identify which data cleansing method applied.
part-of-speech tagging
classification
chunking
coding
Identify which of the following is an operation dashboard?


The following statements describe purposes of data filtering, EXCEPT:
Filtering works well on inconsistent data, which will create accurate filtered data.
It allows users to view specific information that they need.
With filtered data, users can easily perform operations on data without having to sort or move it first.
It can be used to transform existing datasets into new structures by applying logic and algorithms, and then changing the structure into other forms.
The following statements describe about derivative attributes EXCEPT:
The attributes that do not exist in the physical database, but the values derived from existing attributes.
The attribute data value is readily available and requires maintenance.
The attribute AGE is calculated from DATE_OF_BIRTH. The attribute AGE is derived.
The attribute can be produced by performing a calculation or using an algorithm.
Where do we insert a Pivot Table?
Below the last row of data in your worksheet.
Next to the last column of data in your worksheet.
It depends on whether you select to insert the Pivot Table in the current worksheet or a new worksheet and where your cursor is.
Above the first row of data in your worksheet.
What is the use of the VLOOKUP function in MS-Excel?
To get a value in a list or table based on location.
To look up and retrieve data from a specific column in a table.
To look up and count the matching records in a specific column.
To look up a value in a column range.
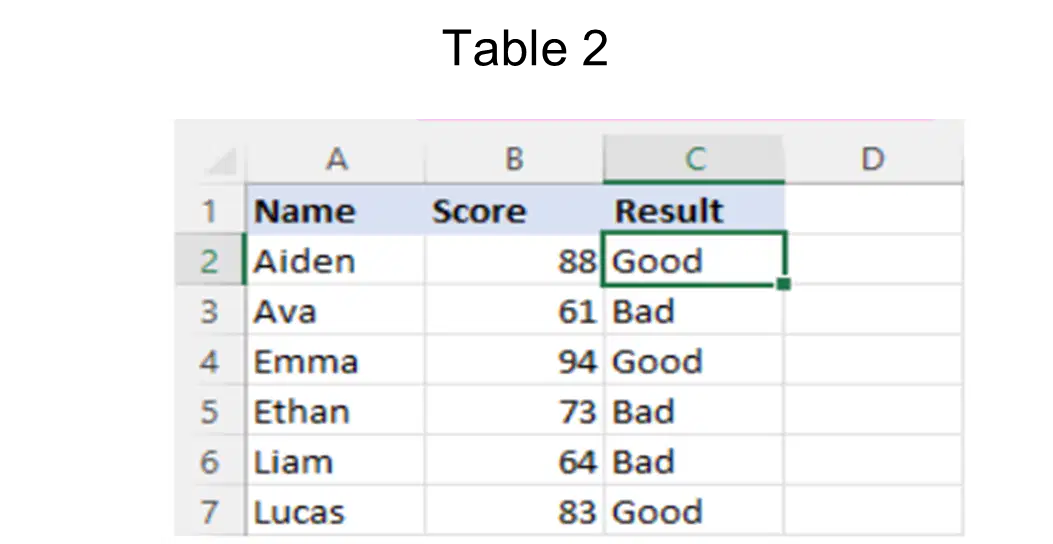
Find the correct function(s) for column C output in Table 2.
I. =IF(B2>80, "Good", "Bad")
II. =IF(B2<80, "Good", "Bad")
III. =IF(B2>80, "Bad", "Good")
IV. =IF(B2<80, "Bad", "Good")
I
IV
II, III
I, IV
Identify the formula to calculate the bonus figure for staff with ID number 1015 in Table 3, from which salaries have been calculated.
=C4+D4/2
=C4+D4*E4*2
=C4*D4/2
=C4*D4*2
Listed below are the benefits of using a pivot table, EXCEPT:
It provides an interactive way to explore data
It allows you to summarize and aggregate large amounts of data quickly
It enables you to quickly change the organization of your data without altering the original dataset.
It automatically updates as you change the data where they originate from
The effective design of a dashboard uses a variety of chart types with fancy colours.
TRUE
FALSE
The size attribute represents 1 as SMALL size, 2 as MEDIUM size, and 3 as LARGE size. This attribute can be considered as a categorical data type.
TRUE
FALSE
Information should be complete to avoid incorrect and undesirable outcomes.
TRUE
FALSE

