
 Worksheets
Volcano Hunters Lesson 3 Quiz
Total questions: 8
Worksheet time: 4mins
Name
Class
Date
1.
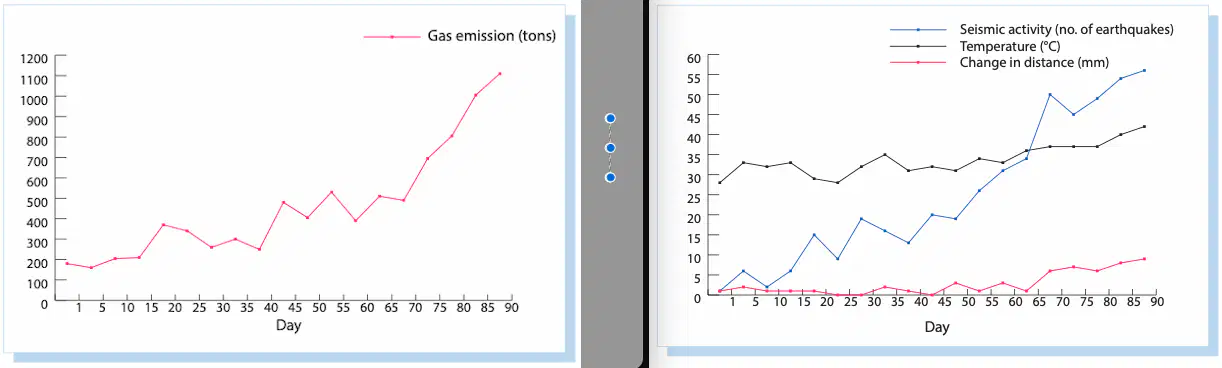
The US Geological Survey uses a nationwide volcano alert system to categorize volcanoes into 4 warning levels- Normal, Advisory, Watch, and Warning. They are used to notify the public about the likelihood of an eruption.
Scientists are monitoring a stratovolcano that is currently labeled with a WATCH warning level. Their data from the past 3 months is shown in the photos.
The team must decide whether to change the current warning level. What should they do?
a)
They should raise the warning level to Warning. The data shows that the volcanic activity is increasing.
b)
They should leave the warning level at Watch. The data doesn’t provide enough evidence that the volcano will erupt any time soon.
c)
They should lower the warning level to Advisory. The data shows that the volcanic activity is decreasing.
d)
They should lower the warning level to Normal. The data shows the typical variations of an inactive volcano.
2.
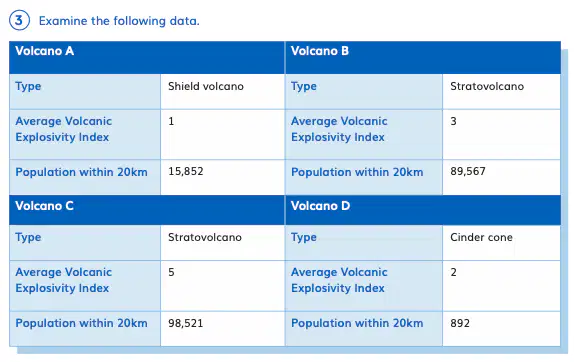
Examine the following data. Which volcano would pose the biggest threat if erupted?
a)
Volcano A
b)
Volcano B
c)
Volcano C
d)
Volcano D
3.
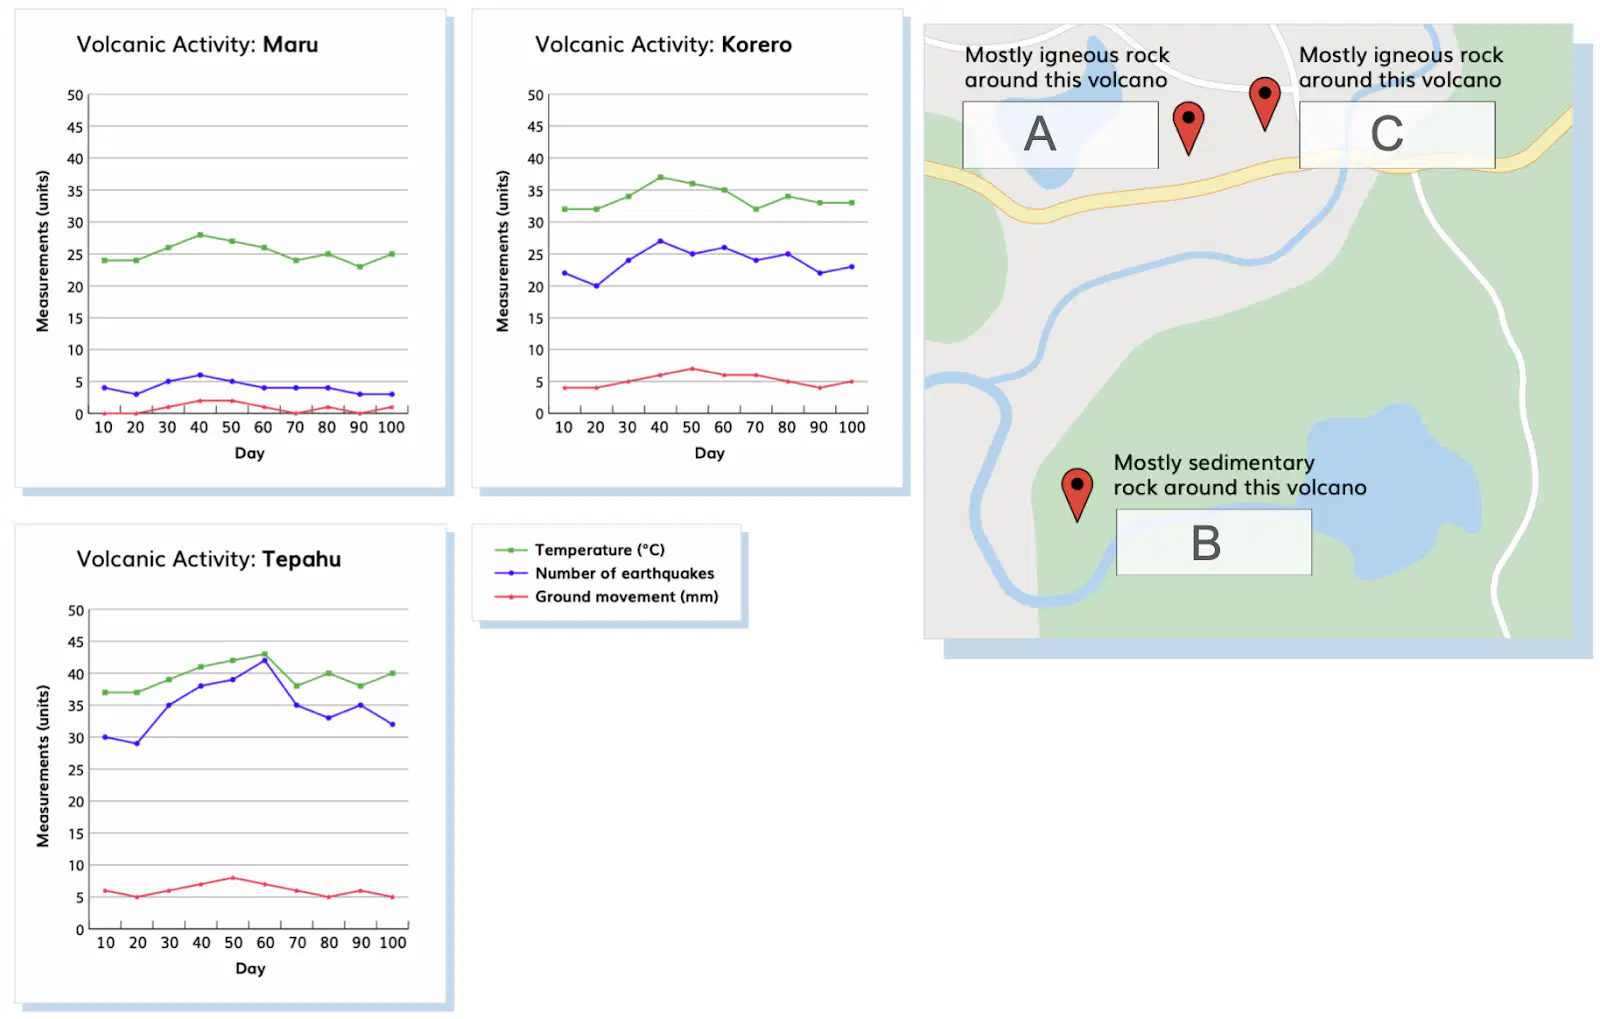
Scientists are collecting data on three volcanoes found in the same region. The data the scientists collect on the volcanoes is shown in the graphs.
Which pin is most likely to show the location of the volcano Maru? Use data from the graphs to help you decide.
a)
A
b)
B
c)
C
4.

Scientists are collecting data on three volcanoes found in the same region. The data the scientists collect on the volcanoes is shown in the graphs.
Complete the statement below. Use the information from the graphs and map to help you.
[Maru / Korero / Tepahu] is probably closest to the plate boundaries. We know this because the data for this volcano showed the highest number of earthquakes.
a)
Maru
b)
Korero
c)
Tepahu
5.

Scientists are collecting data on three volcanoes found in the same region. The data the scientists collect on the volcanoes is shown in the graphs.
The scientists identify patterns to determine when the volcanoes were most volatile over the past three months.
When was Tepahu most volatile?
a)
Days 10-20
b)
Days 30-40
c)
Days 50-60
d)
Days 90-100
6.
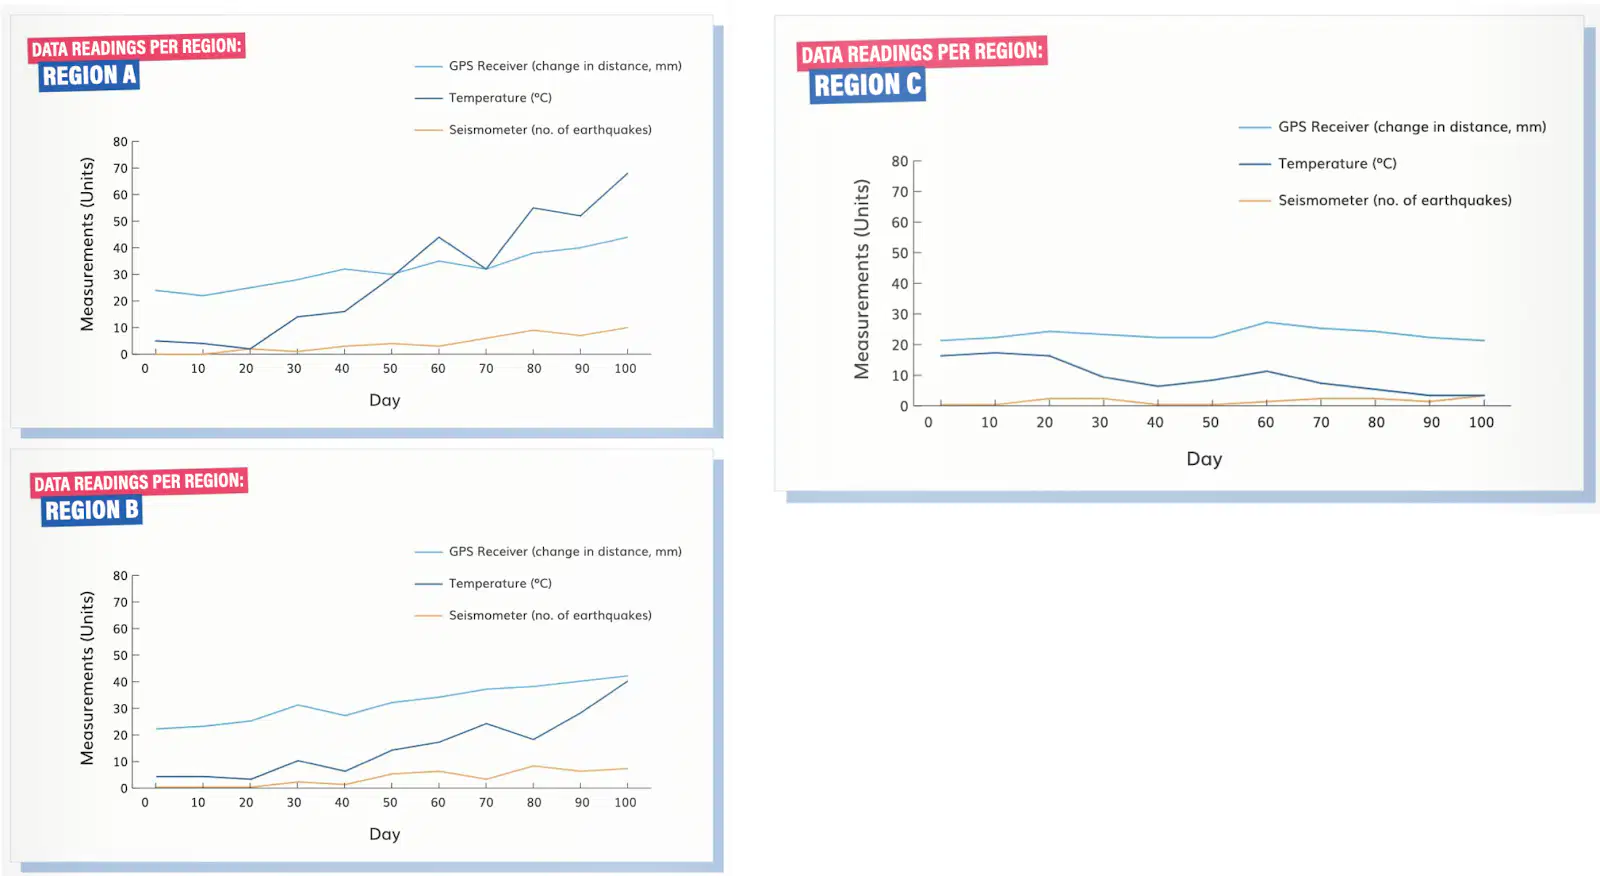
Evaluate the volcano monitoring data from 3 regions below. Which of the following regions is MOST likely to have an eruption soon? Why?
a)
Region B because the GPS movement is higher than the temperature
b)
Region A because all data points are increasing, and are higher than Regions B an C
c)
Region C because all data points are decreasing or remaining stable
7.

Evaluate the volcano monitoring data from 3 regions below. Which of the following regions is LEAST likely to have an eruption soon? Why?
a)
Region C because all data points are decreasing or remaining stable
b)
Region B because the GPS movement is higher than the temperature
c)
Region A because all data points are increasing
8.

Evaluate the historic volcano monitoring data below. Which volcano do you think should be closely monitored for a dangerous eruption, and why?
a)
Fernandina, because it is a shield volcano and had no eruptions in 1981
b)
Fernandina, because it was active most recently
c)
Kelut, because it has a short name
d)
Kelut, because it has a high VEI and are population nearby
100 %

