
 Worksheets
Stress on Reactions
Total questions: 17
Worksheet time: 17mins

Which of the following graphs represents an exothermic reactio?
A
B
C
D

In this graph, ΔE is ___
Activation Energy
Heat Energy
Exothermic
Increasing the temperature in a reaction lowers the activation energy.
True
False
Increasing the concentration increases the number of collisions and therefore the number of effective collisions.
True
False
Catalysts increase the reaction rate by lowering the activation energy
True
False

For which reaction is the activation energy higher?
With the catalyst
Without the catalyst

Which letter shows the activation energy?
A
B
C
D
E

Which letter shows the heat change?
A
B
C
D
E
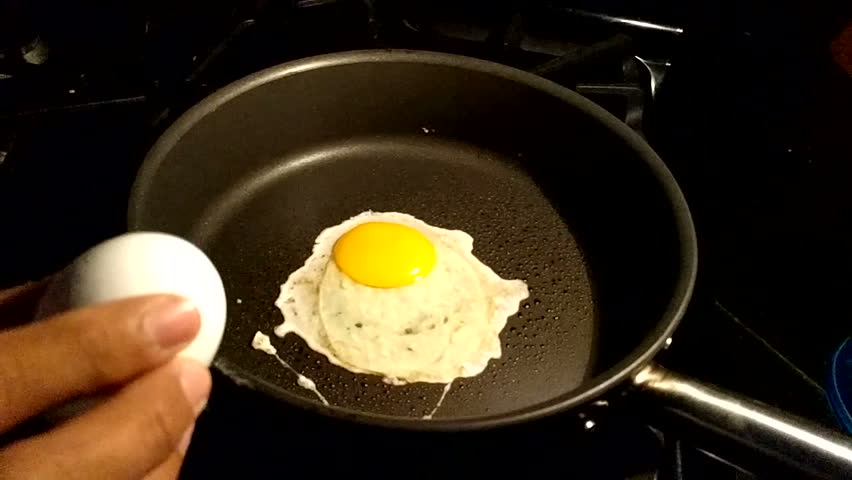
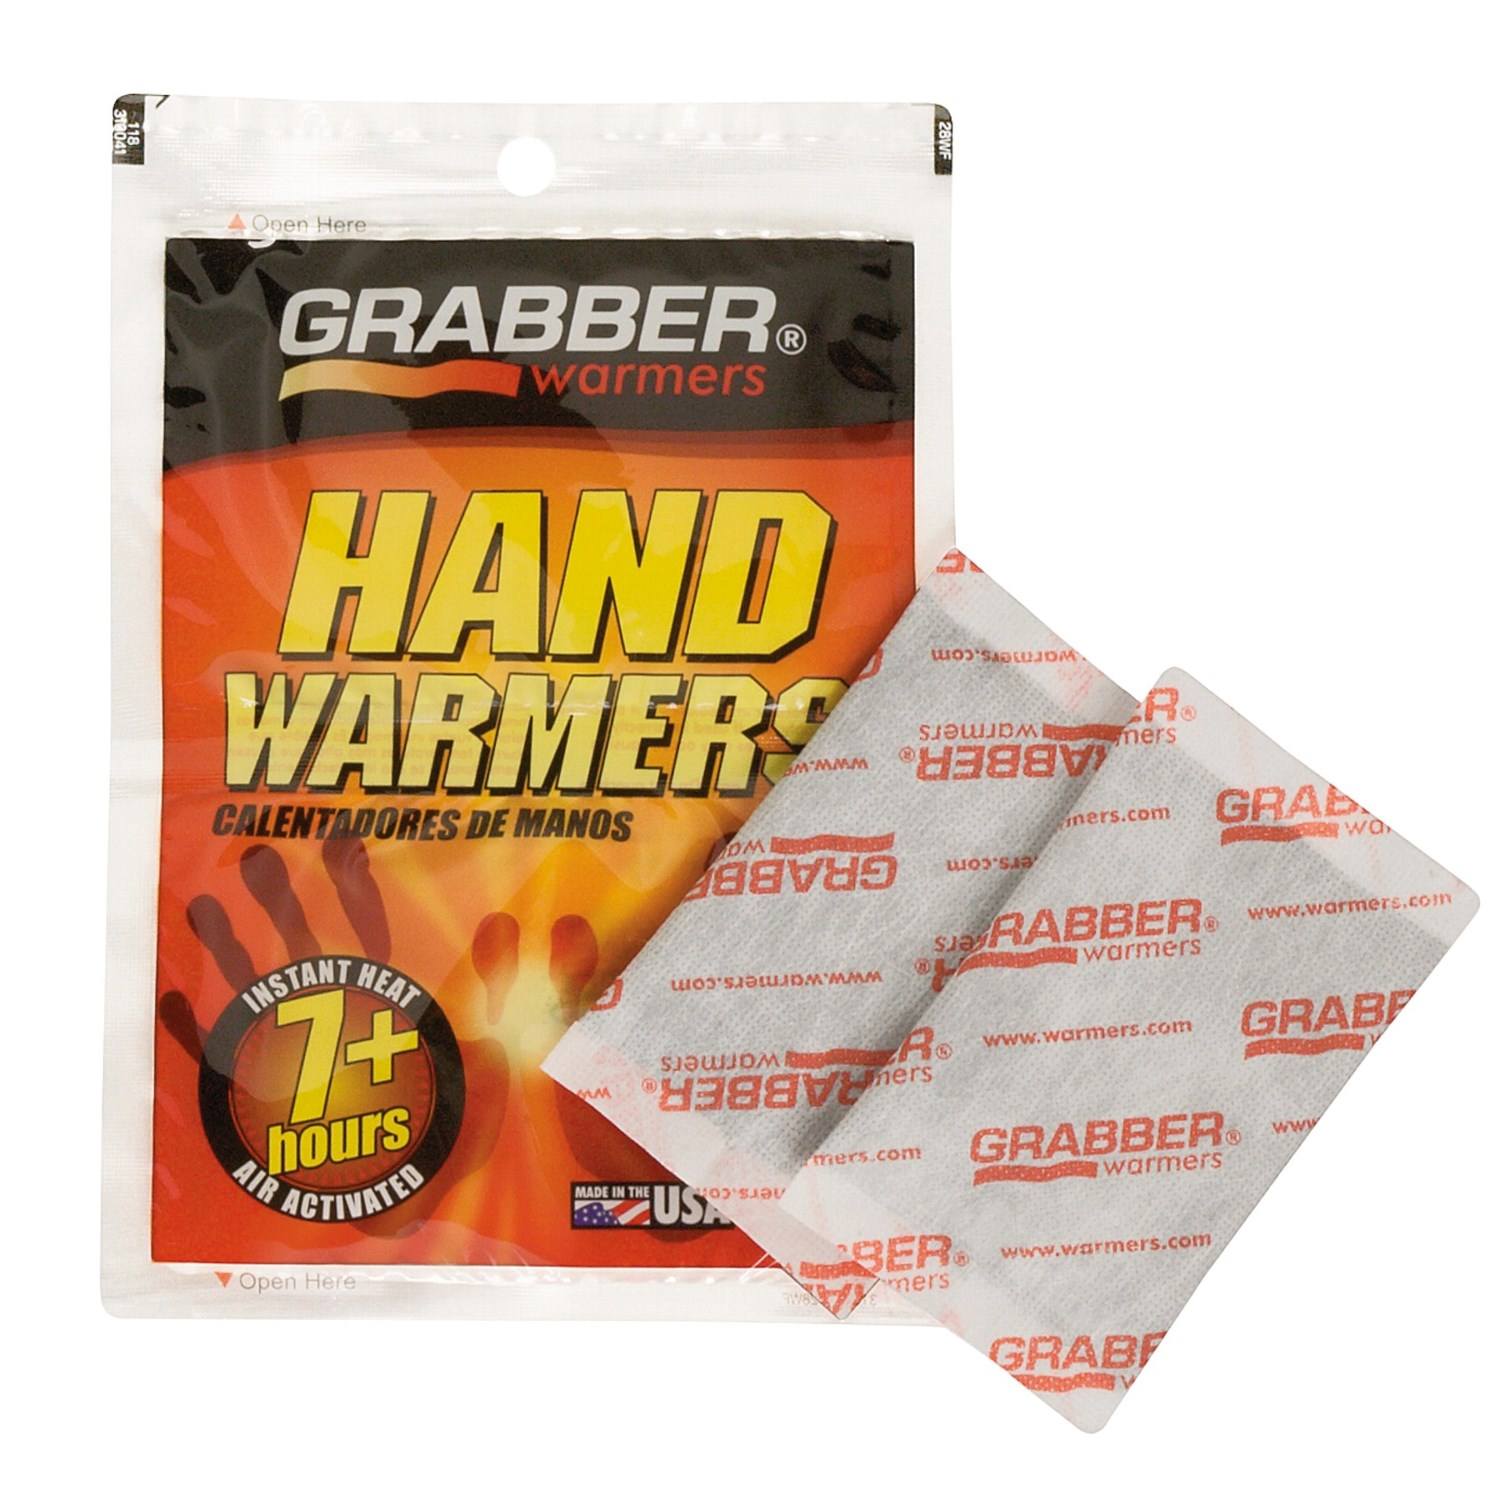
What type of reaction occurs in a hand warmer?
exothermic
endothermic
Removing O2(g) will
Using a catalyst

H2 (g) + Cl2 (g) <−> 2HCl (g) + heat
If the pressure in the system is increased, the equilibrium will _______.
2SO2(g)+O2(g) ⇌ 2SO3(g) + Heat
Adding SO2(g) will
shift equilibrium right
shift equilibrium left
increase rate of reaction
have no change
2SO2(g)+O2(g) ⇌ 2SO3(g) + Heat
Increasing the temperature will...
shift equilibrium right
shift equilibrium left
increase pressure
have no change
For this reaction at equilibrium, which combination of temperature and pressure would give the greatest equilibrium yield of products?
heat + W(g) + X(g) ⇌ 2Y(g) + Z(g)
High pressure and high temperature
High pressure and low temperature
Low pressure and high temperature
Low pressure and low temperature

