
 Worksheets
ACAP Science Practice (Weather, Climate, and Plate Tectonics)
Total questions: 30
Worksheet time: 2hrs 43mins
Stacey and her family are hiking in Olympic National Park in the state of Washington. Stacey is pointing out the valleys and explaining how they form. She knows that glaciers are still in the park.
What evidence does Stacey look for to determine whether the valleys were formed by glaciers?
valleys with lots of trees on either side because as the glaciers retreated they deposited seeds picked up from other areas
valleys with lots of fossils in the rock layers because as the glaciers were increasing in size, the ice preserved remains of organisms
valleys that are V-shaped because when the glaciers melted, the flowing water quickly cut down through rock
valleys that are U-shaped because when the glaciers slowly moved through the area they scraped away and smoothed the rock

A student plans to further study how water affects weathering in rocks. Which is the best question for the student to investigate to continue this study?
How do plants affect weathering?
Does wind speed affect weathering in rocks?
Does the type of rock determine how fast water will weather it?
Does littering by humans cause rocks to weather faster?

Students created a model to explain how the flow of Earth's internal energy drives a cycling of matter between Earth's surface and deep interior. They took a beaker with water and placed one third of it over a hot plate, one third of the beaker over open air, and one third of it over a cool wooden block.
Then, they added drops of food coloring over the cool end of the beaker to observe the movement of the cool water. Which would most likely be what students would observe next?
The cool water would rise and travel toward the hot end because cool water is more dense than hot water.
The cool water would sink and travel toward the hot end because cool water is more dense than hot water.
The cool water would rise and travel toward the hot end because cool water is less dense than hot water.
The cool water would sink and travel toward the hot end because cool water is less dense than hot water.

The diagram shows where fossils of two different species, Lystrosaurus and Glossopteris, have been found on more than one continent.
How is this kind of evidence best used by scientists?
to determine how the rocks formed on the different continents
to predict how the continents might look in the future with continued plate movement
to explain the process of how the continents are in different locations today than in the past
to support the theory that these continents were once joined together but then moved apart over time
Martin recently moved to a town in another state where the main industry is coal mining. He concludes that the area must be much more rich in coal deposits than his old home.
Which would best explain why coal is distributed unevenly?
The water cycle causes sediments to be deposited in new areas.
Some areas receive more lightning strikes than others.
Divergent plate boundaries allow magma to erupt and form into coal.
Some areas were once populated by dense plant matter that decayed over millions of years.
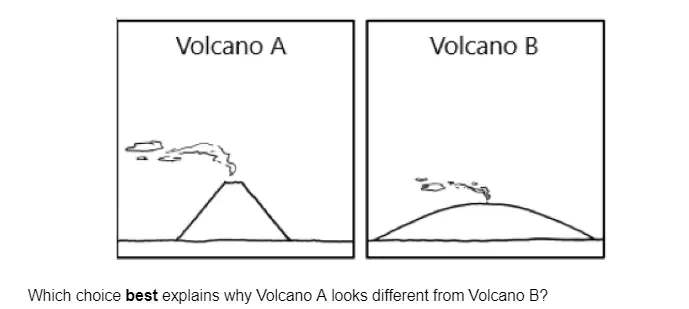
Tessa is studying sketches of two different volcanoes.
Which choice best explains why Volcano A looks different from Volcano B?
Volcano A was formed by very viscous lava.
Volcano B was formed by very viscous lava.
Volcano A was formed by ash only.
Volcano B was formed by ash only.
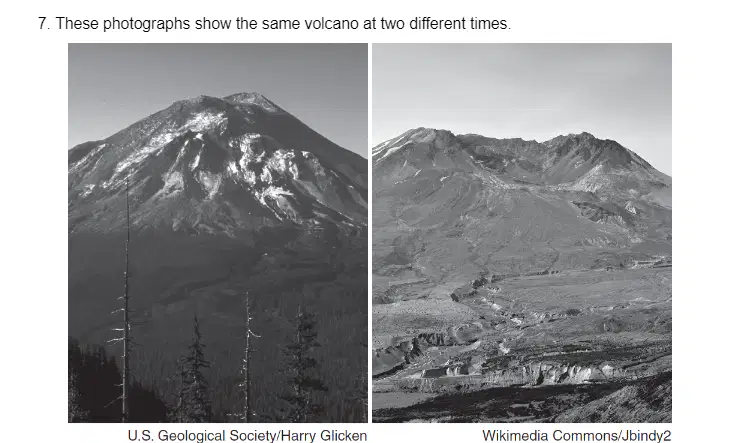
Nolan claims that it took millions of years for the volcano to look like it does in the photograph on the left and only minutes for the volcano to look like it does in the photograph on the right. What is the most likely cause for the volcano to look like the picture on the right which would support Nolan's claim?
repeated eruptions of lava
extreme pressure
lava cooling to become rock
rocks thrown from the volcano pile up around the crater
Students are planning an investigation to model different parts of the rock cycle using a collection of different colored marshmallows. For one part of their investigation, they decide to leave the marshmallows in a bowl of lemon juice overnight. This would best represent which process?
sedimentation
crystallization
chemical weathering
physical weathering

The map shows where glaciers existed 250 million years ago. Which explanation is supported by the data in the map?
Glaciers formed in the locations shown on the map because of a change in climate that caused the southern hemisphere to experience an ice age.
Glaciers at one time covered most of the continents in the world, but the glaciers melted and the areas on the map are places where glaciers still remain.
There is evidence of glaciers in the areas identified on the map because the current climate in those areas still supports glacier formation.
There is evidence of glaciers in the areas identified on the map because the continents were once located near a polar region, but then over time the continents moved apart.

Three earthquakes have been recorded on the world map. They are marked A, B, and C.
What was responsible for Earthquake B?
Plates spreading at the mid-ocean ridge
One oceanic plate moving beneath another oceanic plate at a trench
Two continental plates colliding
Two plates sliding past one another

Students are studying plate movements.
Which student correctly identified what causes seafloor spreading to occur?
Student 1
Student 2
Student 3
Student 4
A family wants to pan for gold during their next vacation. To plan their vacation, they decide they want to research different locations in the United States. Which would be the best question about gold distribution to research in order to find the most gold?
What natural hazards exist around gold panning sites?
What processes cause gold to be distributed unevenly?
Which states have the highest concentration of gold distribution?
Which gold panning sites are located close to major cities and airports?

Which prediction about the weather is accurate, based on the evidence in the map?
Location W will have cooler temperatures, because a cold front is moving toward it.
Location X will have cloudy skies, because it is positioned within a high-pressure system.
Location Y will be stormy, because it is positioned where a cold front meets a warm front.
Location Z will be calm, because it is far away from both the high- and low-pressure systems.

The map shows the percentages of available freshwater that humans withdrew from groundwater or surface water in 1995. In that year, the human population worldwide was 5.7 billion. By 2025, the human population is expected to reach 8 billion.
South America and Australia will withdraw more than 40% of their available freshwater, changing their areas on the map to the darkest shade of gray.
Europe, Asia, and North America will withdraw 20 to 40% of their available freshwater, changing their areas of the map to a darker shade of gray.
All countries will reduce their freshwater needs, which means areas marked with dark shades of gray will change to the lightest shade of gray.
Freshwater needs will be met in other ways, which means the darkest shade of gray will no longer appear in any areas of the map.

The map shows the global circulation pattern of ocean currents.
Elliot wants to set up a model that best represents how this type of pattern is created in the ocean. Which model should he use?
Add red food coloring to one end of a tank of water and blue food coloring to the other. Then allow a fan to blow across the surface.
Add several drops of red food coloring and several drops of blue food coloring to water in a jar. Then place the lid on and shake the jar.
Slowly pour hot water that has red food coloring into a tank of water that is at room temperature. Then quickly pour cold water that has blue food coloring into the tank.
Pour hot water that has red food coloring and cold water that has blue food coloring into a tank of water that is at room temperature. Then have a heat lamp shine on the water.
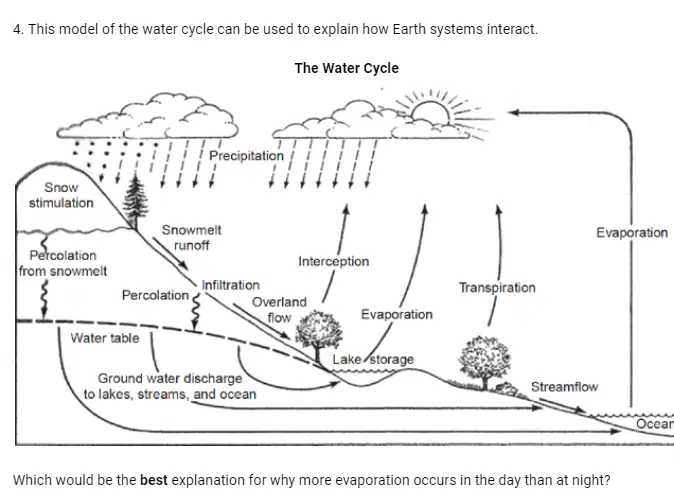
This model of the water cycle can be used to explain how Earth systems interact.
Which would be the best explanation for why more evaporation occurs in the day than at night?
The sun is unable to warm the surface of water at night.
Precipitation occurs more often at night than during the day.
Condensation occurs more frequently at night when temperatures drop.
Runoff can alter the landscape of Earth’s surface, changing the path of streams and rivers.
Students conducted an experiment to investigate how energy from the sun is distributed between Earth’s surface and its atmosphere by convection and radiation. They used a lamp, a jar filled with 100 mL of soil, a jar filled with 100 mL of water, and two thermometers to record the temperature of the jars. Students recorded the initial temperature of each jar, the temperature after the lamp has been on for ten minutes, and then the final temperature after the lamp has been turned off for ten minutes.
Which conclusion is best supported by the data from this experiment?
Water heats up and cools down faster than soil.
Water heats up and cools down slower than soil.
Water heats up slower than soil but cools down faster than soil.
Water heats up faster than soil but cools down slower than soil.

The map shows the locations of two cities, 1 and 2, the centers of a high-pressure system and a low-pressure system, and two weather fronts.
Which question can be answered using the information shown in the map?
Which city is likely to have a blizzard?
Which city is likely to have a sunny sky?
Which city recently experienced rain?
Which city recently experienced a decrease in temperature?

The first graph shows changes in carbon dioxide (CO2) in the atmosphere from 1740 to 1980.
The second graph shows the changes above or below average temperatures from 1880 to 2010.
Based on these two graphs, a student claims that humans are causing global temperature change.
Which question, when answered, would support the student’s claim?
How much CO2 is produced by burning fossil fuels every year?
Is the Greenhouse Effect increasing the amount of CO2 in the atmosphere?
Do atmospheric temperatures change before or after changes occur in CO2 levels?
What is the relationship between the amount of CO2 produced by volcanoes and atmospheric temperature?
Petroleum is a fossil fuel used to make plastic. Which idea best reduces the environmental impact of plastics and fossil fuels at the same time?
Pack goods to be shipped in plastic containers.
Find inexpensive ways to use vegetable oil for fuel.
Design a car completely made from recycled plastic.
Convert plastic bags into fuel for cars, trucks, and planes.
Tanisha has two different setups to model how the unequal heating of Earth results in ocean currents. Each setup has a large bowl full of water. She adds a small amount of dried leaf spice to each bowl so that any currents in the water are easily seen.
Tanisha cannot decide which setup will best show how ocean currents form.
The four diagrams show Tanisha’s two different setups.
Which diagram accurately illustrates the flow of ocean currents between Earth’s poles and the equator?

Diagram A

Diagram B

Diagram C

Diagram D

The graph shows global temperature change, as measured by satellites, from 1980 to 2015.
Based on the graph, Grace claims that global temperature changes are due to natural causes. Answering which question would best help support Grace’s claim?
How did the satellites measure temperature in the atmosphere?
What was the amount of fossil fuels burned between 2000 and 2015?
What caused a decrease in the amount of CO2 emissions produced by humans?
How has the amount of energy received from the Sun changed from 2000 to 2015?

Meteorologists use technology such as satellite images, radar, and computers to track severe weather that may form tornadoes. With this information, emergency responders use cell phones to protect and alert people to severe weather. These maps show the risk of tornadoes, ranging from no risk to high risk, over a two-day period in the US.
Which prediction for Day 3 is best supported by the data in the maps?
Satellite weather-tracking cameras will be focused on Florida (FL).
Tornado warning alerts will be sent to cell phones throughout Arkansas (AR).
Radar images will show an increasing risk of tornadoes throughout Texas (TX).
Severe-weather computer simulations will indicate a high risk of tornadoes throughout Kansas (KS).

Carbon sequestration is the long-term storage of carbon in a solid or liquid form after it has been removed from the atmosphere.
According to the diagram, which processes best describe examples of carbon sequestration?
photosynthesis and death and decomposition
photosynthesis and combustion
cellular respiration and death and decomposition
cellular respiration and combustion
Scientists are monitoring two colliding air masses along a frontal boundary. They are concerned that a tornado may form. Which data collected along the frontal boundary would best alert scientists that the two colliding air masses may cause a tornado?
strong gusty winds and overcast skies along the frontal boundary
air masses of the same temperature and altitude coming together along the frontal boundary
great differences in temperature, humidity, and air pressure on either side of the frontal boundary
great differences in the altitude of clouds, percentage of cloud cover, and direction of wind on either side of the frontal boundary

Julie and Devon are modeling how the Sun heats Earth. Julie hangs a sheet of graph paper on a wall. Devon holds a flashlight and shines it in a straight line toward the graph paper while Julie dims the lights in the classroom. The diagram shows their model of the Sun heating Earth at the equator.
How can the students change their model to represent how the Sun heats Earth in places
where the climate is cold all year?
They can tilt the angle of the graph paper.
They can use graph paper with larger squares.
They can use a flashlight with a narrower beam of light.
They can move the flashlight farther away from the graph paper.
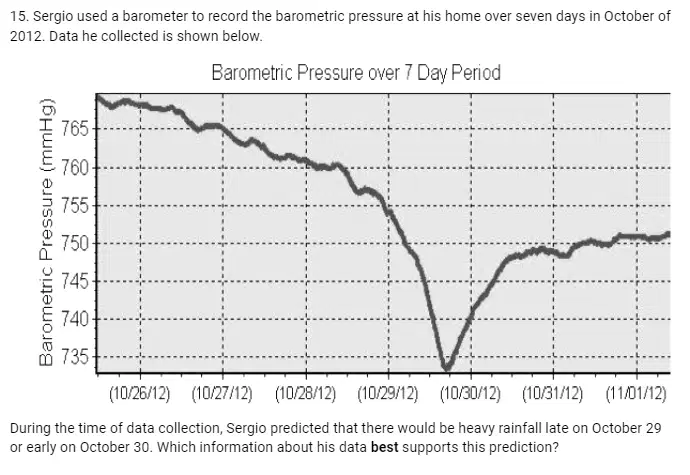
Sergio used a barometer to record the barometric pressure at his home over seven days in October of 2012. Data he collected is shown below.
During the time of data collection, Sergio predicted that there would be heavy rainfall late on October 29 or early on October 30. Which information about his data best supports this prediction?
There was a slight decrease in barometric pressure from the beginning of October 26 to the beginning of October 27.
There was a slight decrease in barometric pressure from the beginning of October 27 to the beginning of October 28.
There was a major decrease in barometric pressure at the beginning of October 29.
Barometric pressure remained steady between the beginning of October 31 and the beginning of November 1.

Tara connects two convection tubes. She adds smoke to one cylinder. The smoke immediately sinks to the bottom of the cylinder, moves into the second cylinder, and then rises. Arrows on the diagram below indicate the path that the smoke traveled.
Which of the following statements best describes why the smoke followed this path?
She connected two hot cylinders. She added smoke at the top of one hot cylinder.
She connected two cold cylinders. She added smoke at the top of one cold cylinder.
She connected one hot and one cold cylinder. She added smoke at the top of the hot cylinder.
She connected one hot and one cold cylinder. She added smoke at the top of the cold cylinder.

The pie chart shows the percentage contributed by each source of all greenhouse gas emissions in the US.
What action would have the greatest impact on reducing the amount of greenhouse gas emissions?
Restrict the amount of livestock grown and sold for meat.
Tax fossil fuels purchased at gas stations more than clean-burning fuels.
Install solar cells on homes and businesses to generate and store energy.
Reduce the number of goods produced for consumers and pass laws requiring people to recycle.

The map shows the levels of impact of human activity on the world’s oceans. The table lists specific effects in four areas, 1, 2, 3, and 4, of the ocean.
Which prediction is most likely to occur if there is a continually increasing human population near Area 2?
Marine species would go extinct because an increased population would require more food.
More ships would travel in this area to deliver goods, resulting in increased waste pollution and a greater chance of oil spills.
More people would mean more trash, meaning that a large trash island would form in Area 2.
Only large cities would be affected by an increase in population. The surrounding ocean waters would remain unaffected.

