
 Worksheets
MVP 2 Part 1 (23-24)
Total questions: 18
Worksheet time: 36mins
Which system of equations has a solution of (-5,-2)?


Consider the system of equations
y=−54x+54
y=34x+4
What is the solution to the system of equations?
(-3,2)
(-2,3)
(−23,2)
(3,−23)
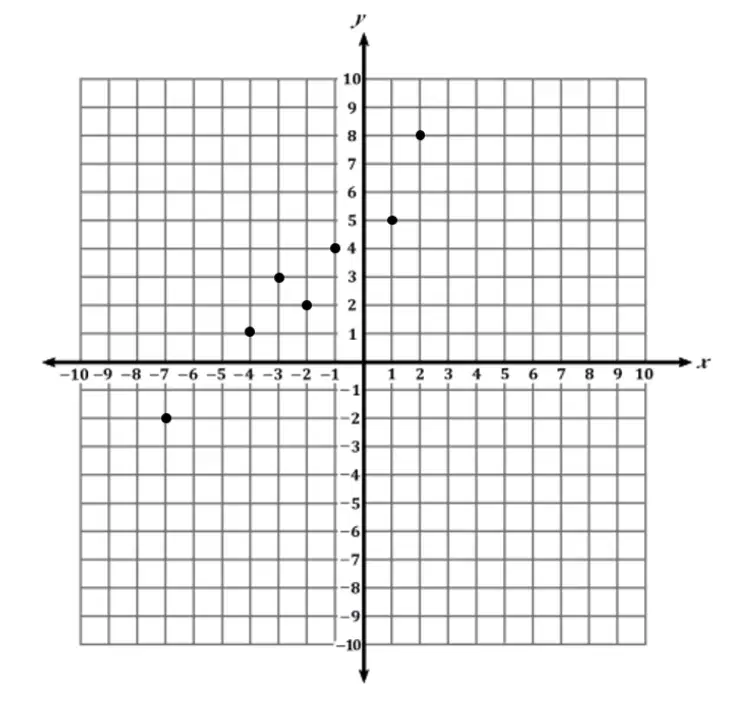
Consider the graph of a function.
Which ordered pair could be added to the coordinate plane so that the graph remains a function?
(-1,0)
(0,2)
(1,-2)
(2,2)
Consider the system of equations
5x+2y=10
5x+2y=12
Which statement is true?
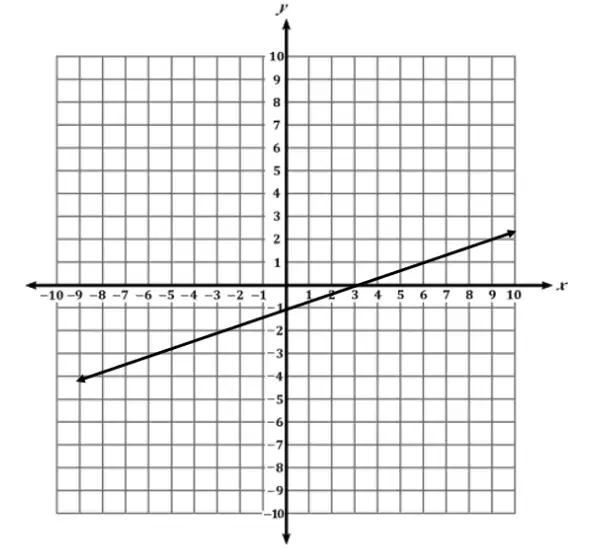
Consider the linear equation graphed on the coordinate plane.
When graphed one the same coordinate plane, which equation results in a system of equations with infinitely many solutions?
y=−3x+1
y=−31x+1
y=31x−1
y=3x−1

Consider the four sets of ordered pairs.
Which set of ordered pairs represents a function?
Set 1
Set 2
Set 3
Set 4
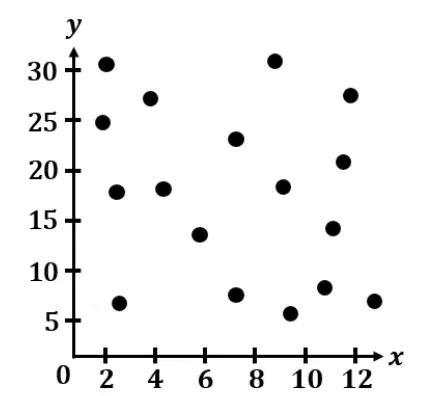
The scatter plot shows the association between two variables, x and y
Which best describes the association shown by the scatter plot?
Linear Association
Negative Association
No Association
Positive Assoctiation

A babysitter's total earnings, in dollars, y for babysitting x hours are represented by the equation y=8.5x . The table shows a pet groomer's total earnings for various hours worked.
Which statement about the hourly earning of the babysitter and the pet groomer is true?
The pet groomer’s hourly earnings are $0.75 more per hour than the babysitter’s hourly earnings.
The pet groomer’s hourly earnings are $1.25 less per hour than the babysitter’s hourly earnings.
The pet groomer’s hourly earnings are $1.25 more per hour than the babysitter’s hourly earnings.
The pet groomer’s hourly earnings are equal to the babysitter’s hourly earnings.
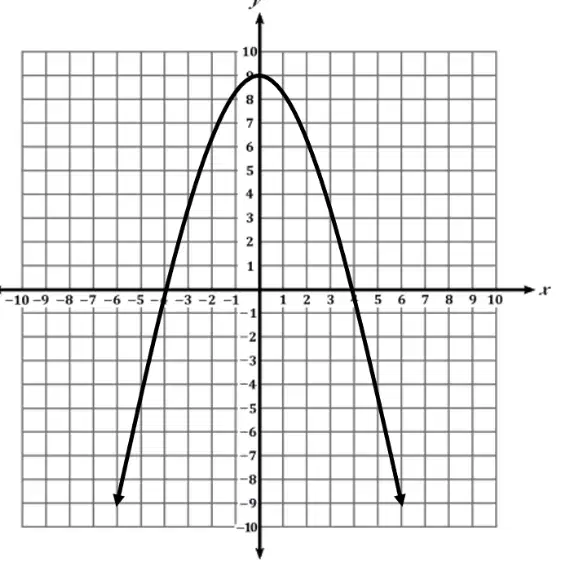
Consider the graph of a function.
Which statement is true?
The graph represents a linear function because the graph intersects both axes.
The graph represents a linear function because the graph is a curve.
The graph represents a nonlinear function because the graph does not intersect the origin
The graph represents a nonlinear function because the graph is not a straight line
Consider the system of equations
y=−12x−9
y=qx−9
For which value of q will the system of equations have infinite solutions?
-21
-12
-9
-3
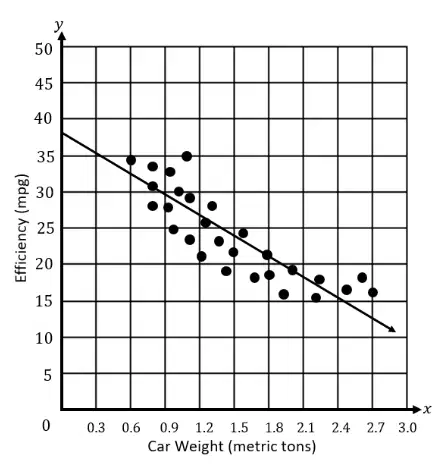
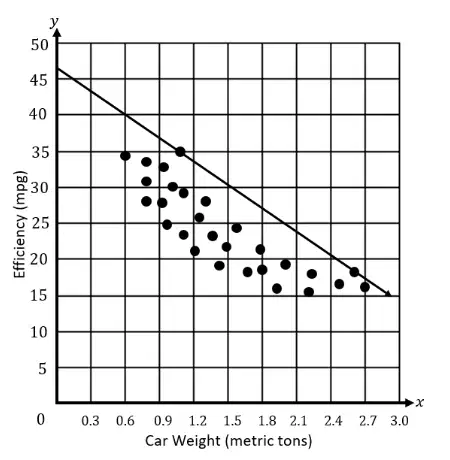
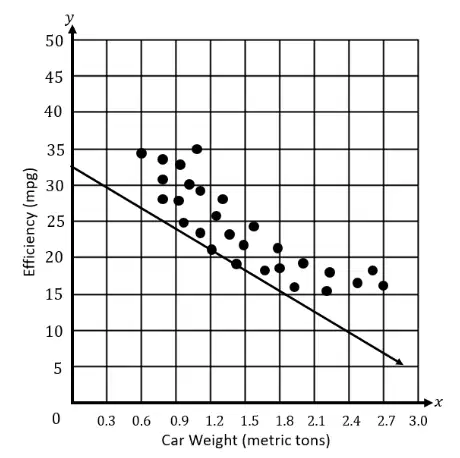
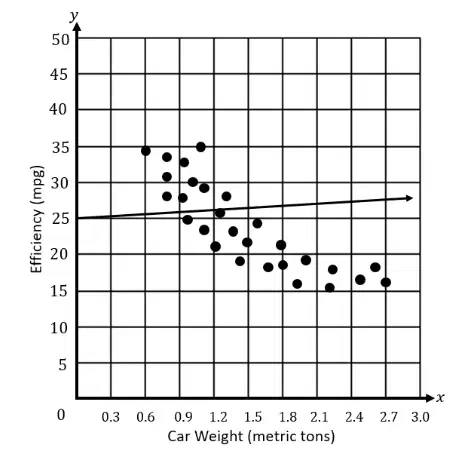
A car manufacturer records the fuel efficiency and weights of different cars. Which scatter plot has the best linear model to represent the car manufacturer’s data?
A system of two linear equations is graphed on the coordinate plane and has exactly one intersection point. What does that intersection point represent?
the maximum (𝑥, 𝑦) pair for both equations
the minimum (𝑥, 𝑦) pair for both equations
the only (𝑥, 𝑦) pair that is a solution to only one of the equations
the only (𝑥, 𝑦) pair that is a solution to both equations
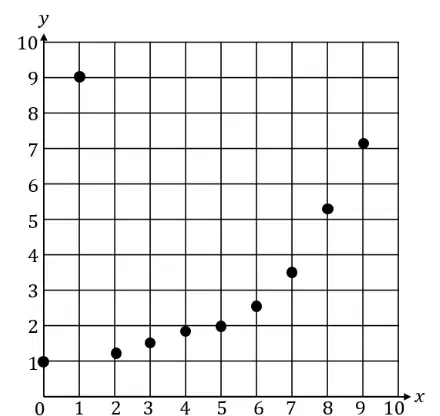
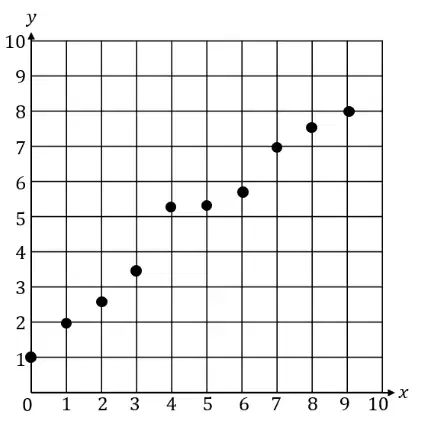
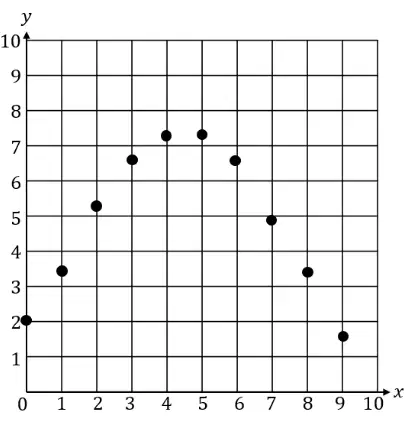
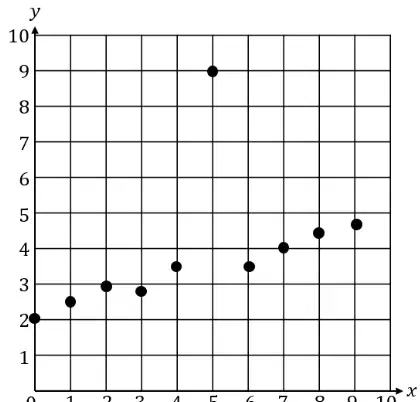
Which scatter plot best suggests a nonlinear relationship between 𝒙 and 𝒚, where there is at least one outlier in the data?

Consider the five equations.
Which two equations represent nonlinear functions?
Equation 1
Equation 2
Equation 3
Equation 4
Equation 5
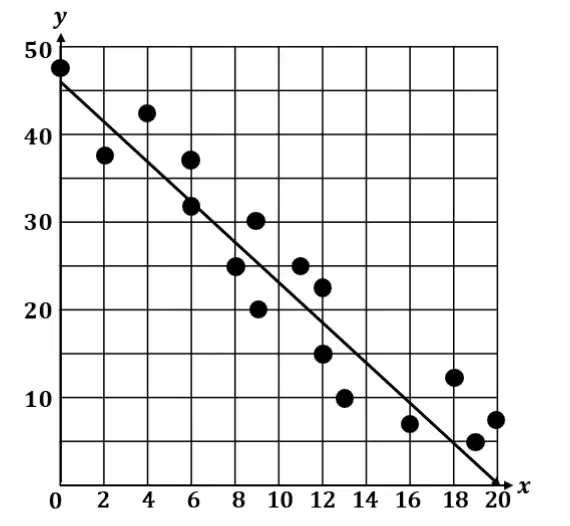
A student draws a line to model a set of data points.
Which statement is true?
The student’s drawing would fit the data better if the line was below all the data points.
The student’s drawing would fit the data better if the line intersected the highest data point.
The student’s drawing is the best fit possible for the data because the line minimizes the distance to each data point.
The student’s drawing is the best fit possible for the data because the line intersects the 𝑥-axis.

The table shows a relation.
Which statement is true?
The relation is a function because each input value has only one output value.
The relation is a function because each output value has only one input value.
The relation is not a function because one input value has more than one output val
The relation is not a function because one output value has more than one input value.
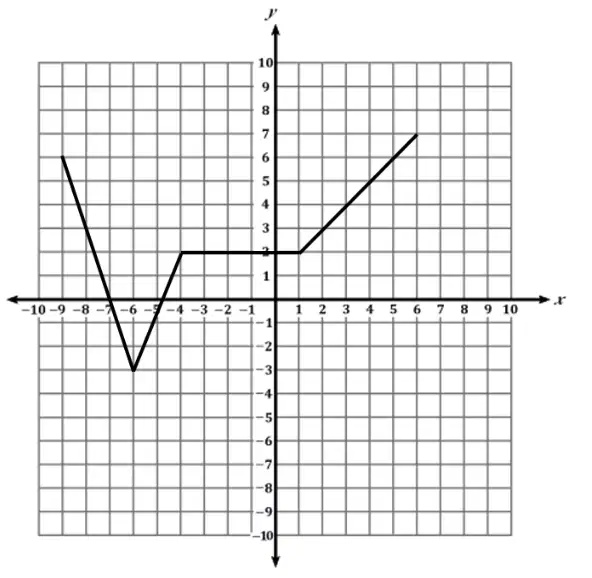
Consider the graph of a function.
Which statement is true?
When 𝑥 is between −6 and −4, the function is increasing, and when 𝑥 is between 1 and 6,
the function is decreasing.
When 𝑥 is between −6 and −4, the function is decreasing, and when 𝑥 is between 1 and 6, the function is decreasing.
When 𝑥 is between −9 and −6, the function is increasing, and when 𝑥 is between 1 and 6, the function is increasing.
When 𝑥 is between −9 and −6, the function is decreasing, and when 𝑥 is between 1 and 6, the function is increasing.
A student writes the linear model 𝒇 = −𝟐𝟎𝒘 + 𝟓𝟕 to represent the fuel efficiency, 𝒇, in miles per gallon, for a vehicle that weighs 𝒘 tons. Based on the linear model, what is the expected fuel efficiency of a vehicle that weighs 𝟏. 𝟑 tons?
83 miles per gallon
31 miles per gallon
24 miles per gallon
3 miles per gallon

