
 Worksheets
Dot plots,stem and leaf
Total questions: 155
Worksheet time: 5hrs 10mins

how many people voted in this dot plot
4
9
3
not here






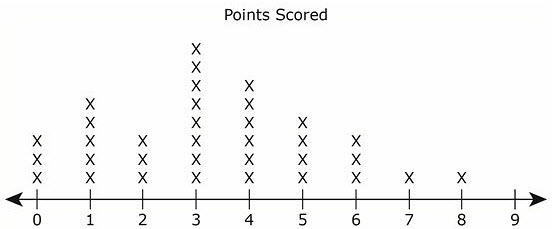
What is the difference between the number of players who scored fewer than 4 points and the number of players who scored more than 4 points?


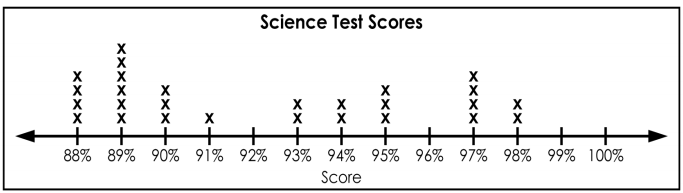
How many students scored 93% or less?
6
16
14
13

Which three ages combined have the highest number of students
6.7.8
8,9,10
10,11,12
4,5,6

How many people visited different states?
3
7
6
8
Why is the title important?
so the information makes sense
provides an overview of the information it contains
gives the readers an indication of the data they will be looking at.
All of them

What is the most common lifespan of the animals?
7
1
10
18

What is the greatest lifespan shown?
3
18
20
6

What age is the outlier?
13
5
10
9

How many more 9 year-olds participated in the spelling bee than 11 year-olds?
5
3
2
1

Melanie said that more than half of the participates in the spelling bee are less than 10 years-old.
agree
disagree

How many students participated in the spelling bee?
(a)

What is the difference in age between the youngest participate and the oldest participate?
(a)
How many students scored 93% or less?
6
16
14
13






What was the day with the least amount of cars sold?
Monday
Tuesday
Wednesday
Thursday



Why is a key important when reading a stem and leaf plot?

How many scored 25 or less free throws?
2
5
7

How many apples were weighed?
6
24
30
21

What is the highest ticket price?
$35
$12
$49
$40

What is the range in ticket prices?
$38
$37
$28
$31

What is the median ticket price?
$8
$5
$33
$35

What is the range in race times?
36
3.6
30
3

What is the SLOWEST race time?
25.3
25.7
28.3
28.9

What is the MODE of the math test scores?
90
0
92
84 and 85

How many lunches cost less than $5.90?
2
3
4
7

What is the range in lunch costs?
$4.80
$4.50
$48.00
$2.00


Which of the following two statements are true?
More people did over 33 push ups than who did less than 32 push ups.
There were 14 people questioned.
More people did more than 33 push ups than did less than 33 push ups.
6 people did 35 push ups

32, 38, 40, 44, 44, 46, 49, 53, 55, 58, 62, 65, 68, 70, 72, 81
He put the data in a stem-and-leaf plot. What number did he leave out of the stem-and-leaf plot?


Find the Median?
95
97.2
96.8
98

What is the Mode?
97.4
97.2
97
96.8

What is the range?
97.2
4
3.3
3.2

The mean is...
the middle
the average number (added together, then divided by the number of dots)
The most frequent number
The middle when in order
The spread/range is...
the greatest number - the lowest number
the average number (added together, then divided by the number of dots)
The most frequent number
The middle when in order

How many kids have dogs and cats for pets?

How many students scored at least 4 points?
0
3
8
11

How many residents visited with relatives fewer than 2 times?
10
19
36
12

How many boys have shoes that are 18 centimeters long?
6
10
2
5


13
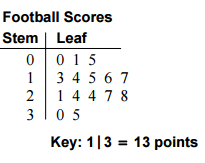
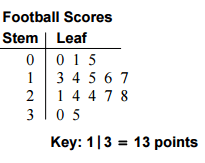


What was the day with the least amount of cars sold?
Monday
Tuesday
Wednesday
Thursday


How many boys have shoes that are 18 centimeters long?
6
10
2
5

What is the frequency and how many tally marks should
1 43 cups have?
8
3
4
What is the frequency and how many tally marks should
3 cups have?
8
3
4
What is the frequency and how many tally marks should
2 21 cups have?
8
3
4
Which amount of flour is used most often?
2 21 cups
3 cups
1 43 cups
How many recipes shown use more than 2 cups of flour?
8
7
9

How many cookie recipes are shown in the data table?
15
3
9

Make a frequency table to organize the data. What is the most common age when students are required to be in school for the states shown?
5
6
7
8
Make a frequency table to organize the data. Which is more common, states that require children to be in school at age 5, or at age 8?
5
8
Make a frequency table to organize the data. How many more states require children to be in school at either age 6 or age 7 than other ages?
5 states
8 states
10 states
15 states

Complete the missing parts on a piece of paper. Which is the most common shoe size?
4 21
6
5 21
9
Complete the missing parts on a piece of paper. Which is the least common shoe size?
4 21
4
5 21
9


Based on the data in the table, how many students preferred the three colors that had the highest frequencies?
How many boys have shoes that are 18 centimeters long?
6
10
2
5

How many boys AND girls have shoes that are 20 centimeters long?
8
9
17
10

How many more boys than girls have shoes that are 22 centimeters long?
16
2
9
4

How many total students were surveyed?
64
60
24
54

How many total shoes were 18 centimeters and 20 centimeters long?
20
18
27
10

How many fewer boys' shoes were 19 cm long than 22 cm long?
4
14
6
10

How many boys were surveyed?
20
29
30
35

How many total girls were surveyed?
29
35
30
20

For which colour did the children vote the most?
red
blue
yellow
orange
green

Which is the least popular colour?
red
blue
yellow
orange
green

Which is the second most popular colour?
red
blue
yellow
orange
green

How many more children voted for green than red?
2
3
4

How many children own a dog or a cat?
12
19
7
5

How many fewer children own a hamster than a goldfish?
2
4
6
8

Choose the TWO least popular pets
dog
cat
hamster
rabbit
goldfish

How many more children own a dog than a rabbit?
12
9
3
15

Choose the TWO most popular sports
football
basketball
gymnastics
karate
dancing

How many children voted altogether?
21
20
18
17

How many fewer children voted for karate than football?
2
3
4

Which is the most favourite day of the week?
Wednesday
Friday
Saturday
Sunday

Which day got the second highest number of vots?
(a)

How many more children voted for Sunday than Monday?
(a)

